## Line Graph: Test Loss vs. Parameters (Non-Embedding)
### Overview
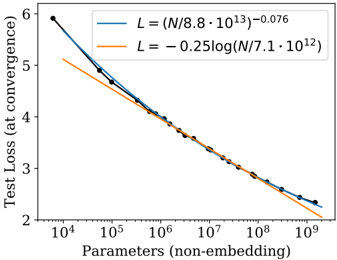
The image is a line graph comparing the relationship between the number of parameters (non-embedding) and test loss at convergence. Two lines are plotted: a blue line representing a power-law decay and an orange line representing a logarithmic decay. The x-axis spans parameters from 10⁴ to 10⁹, while the y-axis ranges from 2 to 6 for test loss.
### Components/Axes
- **X-axis**: "Parameters (non-embedding)" (logarithmic scale, 10⁴ to 10⁹).
- **Y-axis**: "Test Loss (at convergence)" (linear scale, 2 to 6).
- **Legend**: Located in the top-right corner, with two entries:
- **Blue line**: $ L = \left(\frac{N}{8.8 \cdot 10^{13}}\right)^{-0.076} $
- **Orange line**: $ L = -0.25 \log\left(\frac{N}{7.1 \cdot 10^{12}}\right) $
### Detailed Analysis
- **Blue Line (Power-Law Decay)**:
- Starts at approximately (10⁴, 6) and ends at (10⁹, ~2.2).
- Slope: Steeper decline, indicating a faster reduction in test loss as parameters increase.
- Equation suggests a negative exponent, implying test loss decreases as parameters grow.
- **Orange Line (Logarithmic Decay)**:
- Starts at approximately (10⁴, 5.1) and ends at (10⁹, ~2.1).
- Slope: Gradual decline, slower reduction in test loss compared to the blue line.
- Equation uses a logarithmic function, reflecting a sublinear relationship between parameters and loss.
### Key Observations
1. Both lines show a decreasing trend in test loss as parameters increase, but the blue line (power-law) decreases more rapidly.
2. At 10⁴ parameters, the blue line begins ~0.9 units higher than the orange line.
3. By 10⁹ parameters, the lines converge, with the blue line ending slightly lower (~2.2 vs. ~2.1).
4. The logarithmic decay (orange) plateaus more slowly than the power-law decay (blue).
### Interpretation
The graph demonstrates that increasing the number of parameters reduces test loss, but the rate of improvement depends on the scaling relationship. The blue line’s power-law decay ($ L \propto N^{-0.076} $) suggests a faster convergence for large parameter counts, while the orange line’s logarithmic decay ($ L \propto \log(N) $) indicates a more gradual improvement. This implies that architectures with parameter scaling governed by the power-law equation may achieve lower test loss more efficiently at scale. The convergence of the lines at high parameter counts highlights diminishing returns in both scaling strategies.