## Diagram: Set Relationships
### Overview
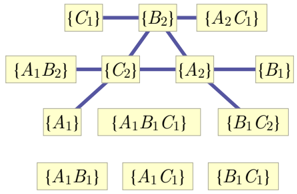
This image depicts a diagram illustrating relationships between sets, likely representing elements and their combinations. The diagram uses rectangular nodes containing set notation and lines connecting these nodes to show relationships.
### Components/Axes
There are no explicit axes or legends in this diagram. The components are rectangular nodes, each containing a set represented by curly braces and alphanumeric characters. The lines connecting these nodes represent relationships.
The nodes and their contents are:
* **Top Row:**
* `{C1}`
* `{B2}`
* `{A2 C1}`
* **Middle Row:**
* `{A1 B2}`
* `{C2}`
* `{A2}`
* `{B1}`
* **Bottom Row (connected to middle row):**
* `{A1}`
* `{A1 B1 C1}`
* `{B1 C2}`
* **Bottom Row (unconnected):**
* `{A1 B1}`
* `{A1 C1}`
* `{B1 C1}`
The lines are thick and blue.
### Detailed Analysis or Content Details
The diagram shows a network of interconnected sets. Let's analyze the connections:
* `{B2}` is connected to `{C1}`, `{A2 C1}`, and `{C2}`.
* `{C2}` is connected to `{A1 B2}`, `{B2}`, `{A2}`, and `{A1}`.
* `{A2}` is connected to `{B2}`, `{C2}`, `{B1}`, and `{B1 C2}`.
* `{A1 B2}` is connected to `{C2}`.
* `{B1}` is connected to `{A2}`.
* `{A1}` is connected to `{C2}`.
* `{A1 B1 C1}` is connected to `{C2}` and `{A1}`. (Note: The line from `{A1 B1 C1}` to `{A1}` appears to be a continuation of the line from `{C2}` to `{A1}`).
* `{B1 C2}` is connected to `{A2}`.
The three sets at the very bottom (`{A1 B1}`, `{A1 C1}`, `{B1 C1}`) are not connected to any other nodes in the diagram.
### Key Observations
* The central nodes `{B2}`, `{C2}`, and `{A2}` appear to be highly connected, suggesting they are key elements or hubs in this relationship network.
* The sets `{A1}`, `{A1 B1 C1}`, and `{B1 C2}` are connected to the central cluster, but less so than `{B2}`, `{C2}`, and `{A2}`.
* The sets `{A1 B2}`, `{C1}`, and `{B1}` are connected to only one other node each.
* The unconnected sets at the bottom (`{A1 B1}`, `{A1 C1}`, `{B1 C1}`) represent combinations that are not directly linked to the main structure shown.
### Interpretation
This diagram likely represents a concept from set theory, possibly illustrating:
1. **Relationships in a Lattice or Poset:** The connections could represent the "less than or equal to" relation in a partially ordered set (poset) or the join/meet operations in a lattice. For example, if `{A1}`, `{B1}`, `{C1}` are basic elements, then `{A1 B1}` could be their union or a higher element in a hierarchy. The diagram might be showing how certain combinations of these basic elements relate to each other.
2. **Graph Theory Representation:** It could be a graph where nodes are sets and edges represent some form of relationship (e.g., subset, superset, intersection, disjointness, or a custom relation). The presence of sets like `{A1 B1 C1}` suggests that the diagram is dealing with combinations of elements.
3. **Data Structure or State Representation:** In a computational context, these nodes could represent states or configurations, and the lines represent possible transitions or relationships between these states.
The unconnected sets at the bottom might represent potential combinations or states that are not currently part of the active or relevant structure depicted by the connected nodes. The overall structure suggests a hierarchical or interconnected system where certain combinations of elements are more fundamental or central than others. The diagram's purpose is to visually map these relationships, allowing for a quick understanding of how different sets or combinations of elements are linked.