## Hierarchical Network Diagram: Node Relationships
### Overview
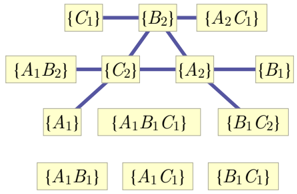
The image depicts a hierarchical network diagram with interconnected nodes labeled using set notation (e.g., {C1}, {A1B1C1}). Nodes are connected via blue lines, forming a tree-like structure with multiple levels of aggregation. The diagram emphasizes relationships between discrete components through combinatorial labeling.
### Components/Axes
- **Nodes**: 13 distinct nodes labeled with set notation:
- Top tier: {C1}, {B2}, {A2C1}
- Middle tier: {A1B2}, {C2}, {A2}, {B1}
- Bottom tier: {A1}, {A1B1C1}, {B1C2}
- Base tier: {A1B1}, {A1C1}, {B1C1}
- **Connections**: Blue lines represent relationships between nodes. No legend is present, and all connections use the same color.
- **Spatial Layout**:
- Top tier nodes positioned at the apex
- Middle tier nodes form a triangular connection pattern
- Bottom tier nodes branch downward
- Base tier nodes appear at the lowest level
### Detailed Analysis
1. **Node Labeling Patterns**:
- Single-element sets: {A1}, {B1}, {C1}
- Two-element combinations: {A1B1}, {A1C1}, {B1C1}
- Three-element combinations: {A1B1C1}
- Hybrid labels: {A2C1}, {A1B2} (mixed case notation)
2. **Connection Logic**:
- Top-tier {C1} connects to {B2} and {A2C1}
- Middle-tier {A1B2} connects to {C2} and {A2}
- {C2} connects to {A1} and {A1B1C1}
- {A2} connects to {B1} and {B1C2}
- Base-tier nodes ({A1B1}, {A1C1}, {B1C1}) have no outgoing connections
3. **Structural Hierarchy**:
- Three distinct levels of aggregation:
- Level 1: Single elements
- Level 2: Pair combinations
- Level 3: Triple combinations
- Top-down flow from {C1}/{B2}/{A2C1} to base-tier nodes
### Key Observations
- **Combinatorial Complexity**: Each level increases in combinatorial complexity (1→2→3 elements)
- **Asymmetrical Branching**: Middle-tier nodes have varying numbers of connections (2-3)
- **Label Consistency**: All labels use curly brace notation with uppercase letters and numbers
- **Missing Elements**: No explicit root node or terminal nodes beyond base tier
### Interpretation
This diagram likely represents:
1. **Data Structure**: A tree-based data model where nodes represent sets and connections indicate parent-child relationships
2. **Dependency Graph**: Illustrating how higher-level components (e.g., {A1B1C1}) depend on lower-level elements ({A1}, {B1}, {C1})
3. **Combinatorial System**: Visualizing all possible combinations of three elements (A, B, C) with varying inclusion levels
The absence of numerical values suggests this is a conceptual model rather than a quantitative analysis. The uniform blue connections imply equal weighting between relationships, while the hierarchical layout emphasizes top-down information flow. The mixed-case labels ({A2C1} vs {A1B2}) might indicate different categorization rules for hybrid nodes versus pure combinations.