## Line Graph: Accuracy vs. Epochs for Different Methods
### Overview
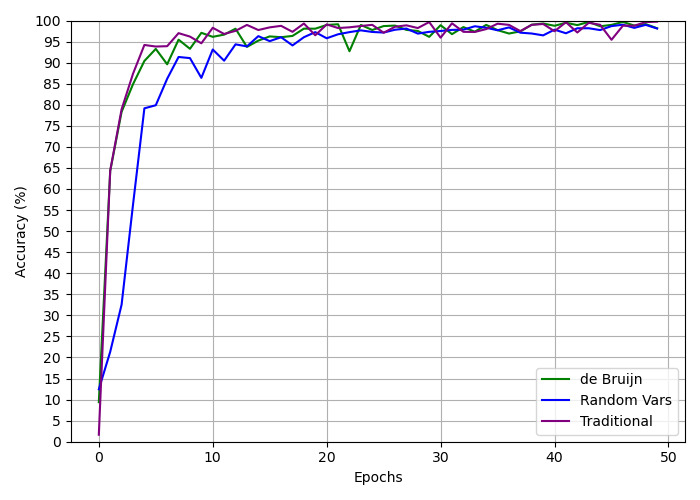
The image is a line graph comparing the accuracy (%) of three methods—de Bruijn (green), Random Vars (blue), and Traditional (purple)—over 50 epochs. All three lines start at 0% accuracy at epoch 0 and converge toward 100% accuracy by epoch 50, with distinct trends in their ascent.
### Components/Axes
- **X-axis (Epochs)**: Labeled "Epochs," ranging from 0 to 50 in increments of 10.
- **Y-axis (Accuracy %)**: Labeled "Accuracy (%)", ranging from 0 to 100 in increments of 5.
- **Legend**: Located in the bottom-right corner, with three entries:
- Green line: "de Bruijn"
- Blue line: "Random Vars"
- Purple line: "Traditional"
### Detailed Analysis
1. **de Bruijn (Green Line)**:
- Starts at 0% at epoch 0.
- Rises sharply to ~95% by epoch 5.
- Experiences a minor dip (~90%) around epoch 10 but recovers to ~98% by epoch 15.
- Stabilizes near 98-100% after epoch 15.
2. **Random Vars (Blue Line)**:
- Starts at 0% at epoch 0.
- Rises steeply to ~90% by epoch 5.
- Exhibits significant fluctuations (e.g., ~85% at epoch 10, ~95% at epoch 15).
- Stabilizes near 95-100% after epoch 15.
3. **Traditional (Purple Line)**:
- Starts at 0% at epoch 0.
- Rises gradually to ~90% by epoch 5.
- Maintains a smoother ascent, reaching ~95% by epoch 10 and ~98% by epoch 15.
- Stabilizes near 98-100% after epoch 15.
### Key Observations
- All three methods achieve near-100% accuracy by epoch 50, but their paths diverge significantly in the early epochs.
- **de Bruijn** and **Traditional** show faster initial convergence compared to **Random Vars**, which exhibits higher variability.
- After epoch 15, all lines converge and plateau, suggesting diminishing returns on accuracy gains with additional epochs.
- **Random Vars** has the most pronounced fluctuations, likely due to inherent randomness in its variable selection process.
### Interpretation
The graph demonstrates that all three methods are highly effective at achieving high accuracy with sufficient epochs. However, **de Bruijn** and **Traditional** outperform **Random Vars** in the early stages, likely due to more structured or deterministic approaches. The convergence after epoch 15 implies that beyond a certain threshold, the choice of method has minimal impact on accuracy, highlighting potential inefficiencies in over-iterating. The fluctuations in **Random Vars** underscore the trade-off between randomness and stability in training processes. This analysis suggests optimizing epoch counts to balance computational cost and performance gains.