## Line Chart: Accuracy vs. Epochs for Different Methods
### Overview
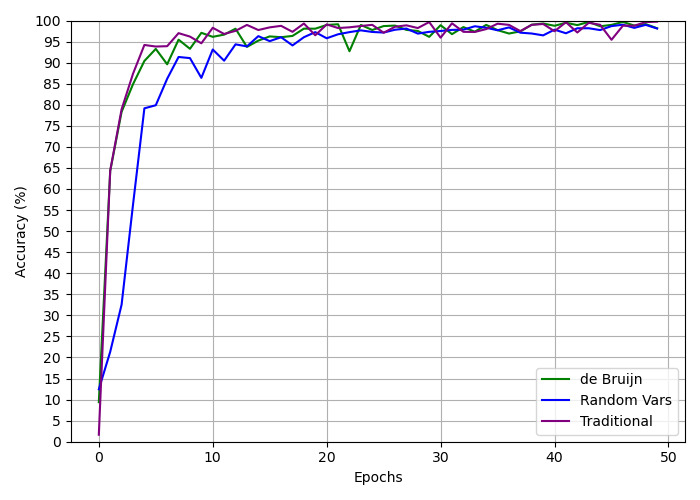
The image is a line chart comparing the accuracy of three different methods ("de Bruijn", "Random Vars", and "Traditional") over 50 epochs. The chart displays how the accuracy of each method changes as the number of epochs increases.
### Components/Axes
* **X-axis:** Epochs, ranging from 0 to 50 in increments of 10.
* **Y-axis:** Accuracy (%), ranging from 0 to 100 in increments of 5.
* **Legend:** Located in the bottom-right corner, identifying each method by color:
* Green: "de Bruijn"
* Dark Blue: "Random Vars"
* Purple: "Traditional"
### Detailed Analysis
* **"de Bruijn" (Green):**
* The line starts at approximately 15% accuracy at epoch 0.
* It rapidly increases to approximately 90% accuracy by epoch 5.
* It plateaus around 97% accuracy after epoch 20, with minor fluctuations.
* **"Random Vars" (Dark Blue):**
* The line starts at approximately 10% accuracy at epoch 0.
* It rapidly increases to approximately 80% accuracy by epoch 5.
* It reaches approximately 95% accuracy by epoch 20.
* It plateaus around 97% accuracy after epoch 30, with minor fluctuations.
* **"Traditional" (Purple):**
* The line starts at approximately 5% accuracy at epoch 0.
* It rapidly increases to approximately 90% accuracy by epoch 3.
* It plateaus around 98% accuracy after epoch 20, with minor fluctuations.
### Key Observations
* All three methods show a rapid increase in accuracy during the initial epochs.
* The "Traditional" method reaches a high accuracy level slightly faster than the other two methods.
* After approximately 20-30 epochs, all three methods plateau, with only minor improvements in accuracy.
* The "Random Vars" method shows more fluctuations in accuracy compared to the other two methods.
### Interpretation
The chart demonstrates the learning curves of three different methods, showing how their accuracy improves over time (epochs). The rapid initial increase in accuracy suggests that the methods quickly learn the underlying patterns in the data. The plateauing of accuracy after a certain number of epochs indicates that the methods have reached their maximum performance level on the given dataset, and further training does not lead to significant improvements. The "Traditional" method appears to converge slightly faster, but all three methods achieve similar levels of accuracy in the end. The fluctuations in the "Random Vars" method might indicate a higher sensitivity to the specific training data or a less stable learning process.