\n
## Line Chart: Accuracy vs. Epochs for Different Methods
### Overview
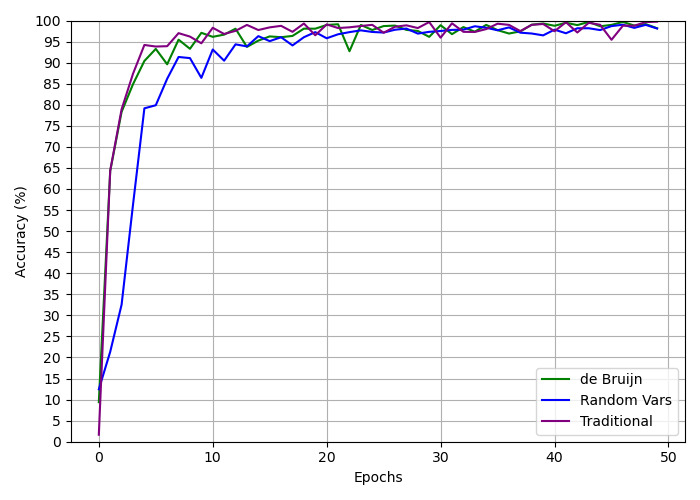
This image presents a line chart illustrating the accuracy of three different methods (de Bruijn, Random Vars, and Traditional) as a function of training epochs. The chart visually compares the learning curves of these methods, showing how their accuracy changes over time.
### Components/Axes
* **X-axis:** Epochs, ranging from 0 to 50.
* **Y-axis:** Accuracy (%), ranging from 0 to 100.
* **Legend:** Located at the bottom-right corner of the chart.
* de Bruijn (Green line)
* Random Vars (Dark Green line)
* Traditional (Purple line)
* **Gridlines:** Vertical gridlines are present to aid in reading the values on the chart.
### Detailed Analysis
The chart displays three distinct learning curves.
* **de Bruijn (Green):** The line starts at approximately 5% accuracy at epoch 0. It increases rapidly to around 95% accuracy by epoch 5, then plateaus, fluctuating between approximately 95% and 98% for the remaining epochs.
* **Random Vars (Dark Green):** This line begins at approximately 5% accuracy at epoch 0. It exhibits a steeper initial increase than the de Bruijn method, reaching around 90% accuracy by epoch 3. It then continues to increase, reaching approximately 97% accuracy by epoch 7, and then plateaus, fluctuating between approximately 96% and 99% for the remaining epochs.
* **Traditional (Purple):** The line starts at approximately 5% accuracy at epoch 0. It increases rapidly to around 95% accuracy by epoch 4, then plateaus, fluctuating between approximately 95% and 99% for the remaining epochs.
**Approximate Data Points (read from the chart):**
| Epoch | de Bruijn (%) | Random Vars (%) | Traditional (%) |
|-------|---------------|-----------------|-----------------|
| 0 | 5 | 5 | 5 |
| 3 | 85 | 90 | 88 |
| 5 | 95 | 97 | 95 |
| 7 | 96 | 97 | 96 |
| 10 | 96 | 98 | 96 |
| 20 | 97 | 98 | 98 |
| 30 | 97 | 98 | 98 |
| 40 | 97 | 98 | 98 |
| 50 | 97 | 98 | 98 |
### Key Observations
* All three methods achieve high accuracy (above 95%) relatively quickly, within the first 5-7 epochs.
* The "Random Vars" method appears to converge slightly faster than the other two methods, reaching a higher accuracy at earlier epochs.
* After the initial rapid increase, the accuracy of all three methods plateaus, indicating that further training does not significantly improve performance.
* The "de Bruijn" method has the most stable accuracy after the initial convergence.
### Interpretation
The data suggests that all three methods are effective in achieving high accuracy. The "Random Vars" method demonstrates a slightly faster convergence rate, potentially making it more efficient for training. The plateauing of all curves indicates that the models are reaching their maximum performance capacity with the given data and training parameters. The stability of the "de Bruijn" method after convergence suggests it might be less sensitive to noise or overfitting. This chart is likely demonstrating the performance of different machine learning algorithms or techniques on a specific task, and the results could inform the selection of the most appropriate method for that task. The fact that all methods reach similar peak accuracy suggests that the choice between them might depend on factors like training time or computational cost.