# Technical Document Extraction: Scatter Plot Analysis
## 1. **Axis Labels and Markers**
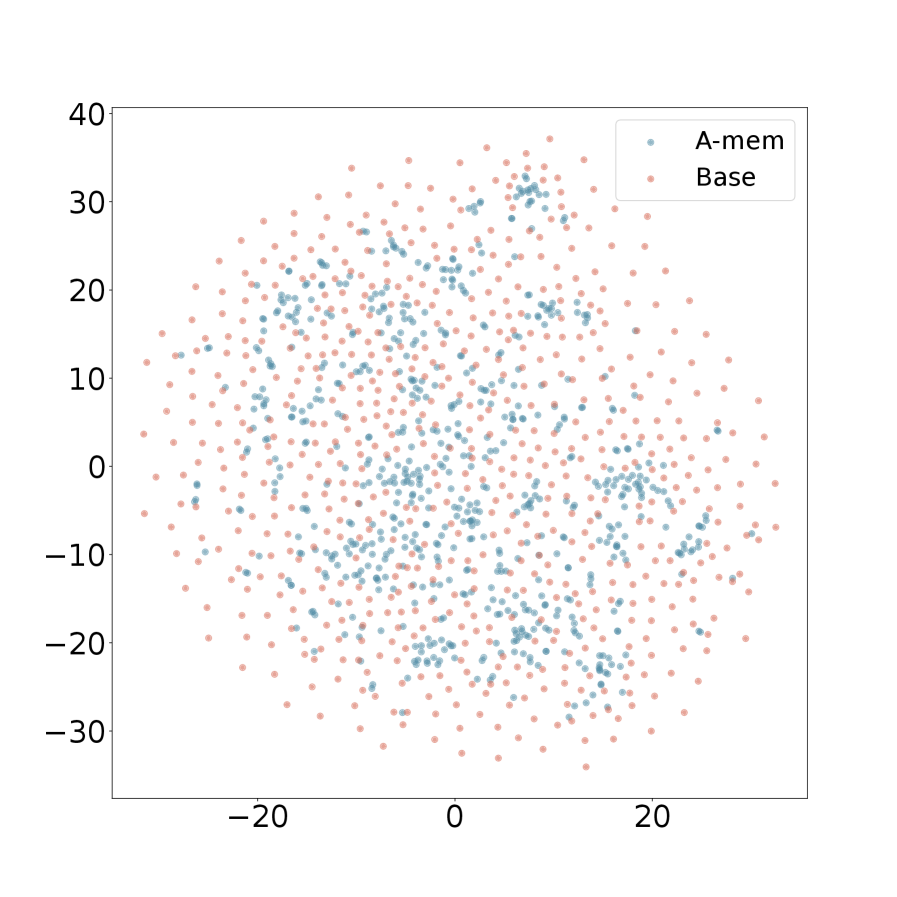
- **X-axis**: Ranges from -30 to 40, labeled with integer increments (e.g., -30, -20, ..., 0, ..., 20, 30, 40).
- **Y-axis**: Ranges from -30 to 40, labeled with integer increments (e.g., -30, -20, ..., 0, ..., 20, 30, 40).
- **Data Points**:
- **A-mem**: Blue circular markers.
- **Base**: Red circular markers.
## 2. **Legend**
- **Location**: Top-right corner of the plot.
- **Labels**:
- `A-mem` (blue).
- `Base` (red).
## 3. **Data Series Analysis**
### A-mem (Blue)
- **Trend**:
- Points are densely clustered near the origin (0, 0).
- Concentration decreases radially outward, forming a roughly circular distribution.
- No clear linear or exponential trend; appears isotropic.
- **Key Observations**:
- High density in the central region (x ≈ 0, y ≈ 0).
- Sparse points near the edges of the plot (e.g., x ≈ ±30, y ≈ ±30).
### Base (Red)
- **Trend**:
- Points are more uniformly distributed across the entire plot.
- Slight preference for outer regions (e.g., x ≈ ±20, y ≈ ±20).
- No strong clustering; appears more dispersed than A-mem.
- **Key Observations**:
- Even distribution across all quadrants.
- Fewer points near the origin compared to A-mem.
## 4. **Spatial Grounding**
- **Legend Position**: [x = 85, y = 35] (relative to plot boundaries).
- **Color Consistency**:
- Blue markers exclusively correspond to `A-mem`.
- Red markers exclusively correspond to `Base`.
## 5. **Trend Verification**
- **A-mem**: Central clustering suggests a potential "attractor" or focal point at (0, 0). No directional bias.
- **Base**: Uniform dispersion indicates no dominant spatial pattern; possibly a control or baseline dataset.
## 6. **Component Isolation**
- **Main Chart**: Scatter plot with two overlapping data series.
- **Legend**: Isolated in the top-right corner, clearly labeled with color-coded categories.
## 7. **Additional Notes**
- **No Title**: The plot lacks a descriptive title.
- **No Text Blocks**: No embedded text outside the legend.
- **Language**: All labels and annotations are in English.
## 8. **Conclusion**
The plot compares two datasets (`A-mem` and `Base`) spatially. `A-mem` exhibits a central clustering pattern, while `Base` shows uniform dispersion. No numerical data table is present; trends are inferred visually.