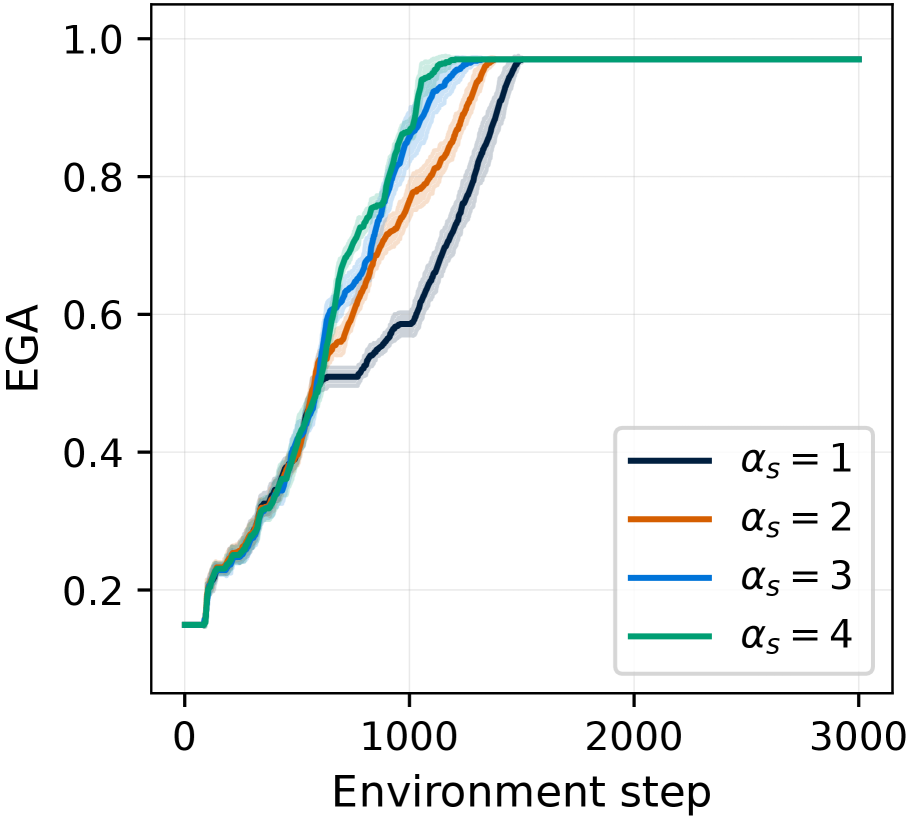
## Line Chart: EGA vs. Environment Step for Different Alpha Values
### Overview
The image is a line chart that plots the EGA (Expected Goal Achievement) on the y-axis against the Environment Step on the x-axis. There are four lines, each representing a different value of alpha (αs): 1, 2, 3, and 4. The chart illustrates how the EGA changes over time (environment steps) for each alpha value. The chart includes a legend in the bottom-right corner that identifies each line by its corresponding alpha value.
### Components/Axes
* **X-axis:** Environment step, ranging from 0 to 3000, with major ticks at 0, 1000, 2000, and 3000.
* **Y-axis:** EGA (Expected Goal Achievement), ranging from 0.2 to 1.0, with major ticks at 0.2, 0.4, 0.6, 0.8, and 1.0.
* **Legend:** Located in the bottom-right corner, the legend identifies each line by its alpha value:
* Dark Blue: αs = 1
* Orange: αs = 2
* Blue: αs = 3
* Green: αs = 4
### Detailed Analysis
* **αs = 1 (Dark Blue):** The EGA starts around 0.2, remains relatively flat until approximately environment step 500, then increases steadily until it reaches approximately 0.95 around environment step 1500, after which it plateaus.
* **αs = 2 (Orange):** The EGA starts around 0.2, remains relatively flat until approximately environment step 500, then increases steadily until it reaches approximately 0.95 around environment step 1250, after which it plateaus.
* **αs = 3 (Blue):** The EGA starts around 0.2, remains relatively flat until approximately environment step 500, then increases steadily until it reaches approximately 0.95 around environment step 1000, after which it plateaus.
* **αs = 4 (Green):** The EGA starts around 0.15, remains relatively flat until approximately environment step 250, then increases steadily until it reaches approximately 0.97 around environment step 1000, after which it plateaus.
### Key Observations
* All four lines show a similar trend: a period of low EGA followed by a rapid increase and then a plateau.
* The alpha values affect the speed at which the EGA increases. Higher alpha values (3 and 4) reach the plateau faster than lower alpha values (1 and 2).
* The final EGA value is approximately the same for all alpha values, around 0.95 to 0.97.
* The shaded regions around each line likely represent the standard deviation or confidence interval, indicating the variability in the EGA for each alpha value.
### Interpretation
The chart suggests that the alpha value influences the learning rate or the speed at which the agent achieves a high EGA. Higher alpha values lead to faster learning, as indicated by the steeper increase in EGA at earlier environment steps. However, the final EGA achieved is similar across all alpha values, suggesting that the alpha value primarily affects the learning speed rather than the ultimate performance. The shaded regions indicate the variability in the learning process, which is also influenced by the alpha value. The data demonstrates that increasing alpha beyond a certain point (likely between 3 and 4) provides diminishing returns in terms of learning speed, as the green line (αs = 4) plateaus only slightly earlier than the blue line (αs = 3).