\n
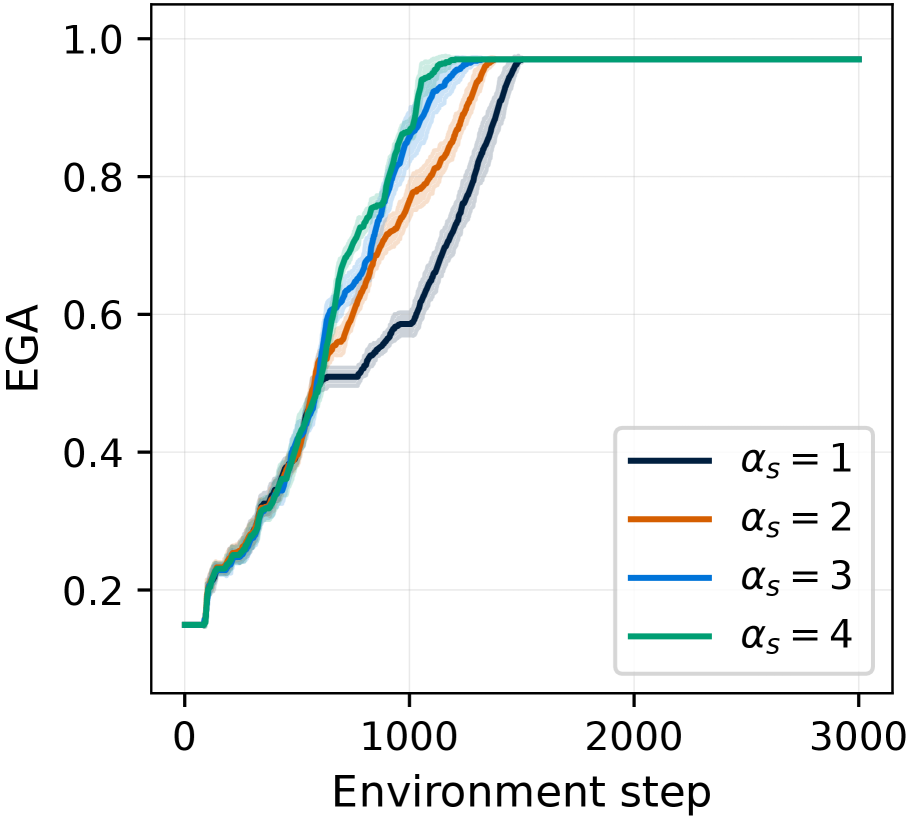
## Line Chart: EGA vs. Environment Step for Different Alpha Values
### Overview
This image presents a line chart illustrating the relationship between EGA (presumably a performance metric) and the Environment Step, for four different values of αs (alpha_s). The chart shows how EGA evolves over time (Environment Step) for each αs value.
### Components/Axes
* **X-axis:** "Environment step" ranging from approximately 0 to 3000.
* **Y-axis:** "EGA" ranging from approximately 0.0 to 1.0.
* **Legend:** Located in the top-right corner, it identifies four lines:
* αs = 1 (Dark Blue)
* αs = 2 (Gray)
* αs = 3 (Orange)
* αs = 4 (Green)
* **Grid:** A light gray grid is present in the background to aid in reading values.
### Detailed Analysis
The chart displays four distinct lines, each representing a different αs value.
* **αs = 1 (Dark Blue):** The line starts at approximately 0.15 at Environment Step 0. It increases relatively slowly until around Environment Step 500, then accelerates, reaching approximately 0.95 at Environment Step 2500.
* **αs = 2 (Gray):** This line begins at approximately 0.18 at Environment Step 0. It exhibits a similar trend to αs = 1, but with a slightly faster initial increase. It reaches approximately 0.98 at Environment Step 2500.
* **αs = 3 (Orange):** Starting at approximately 0.17 at Environment Step 0, this line shows a rapid increase from the beginning. It reaches approximately 0.99 at Environment Step 1500 and plateaus.
* **αs = 4 (Green):** This line starts at approximately 0.13 at Environment Step 0. It shows the fastest initial increase among all four lines, reaching approximately 0.97 at Environment Step 1200 and then plateaus.
All lines converge towards a value of approximately 1.0 as the Environment Step increases.
### Key Observations
* Higher αs values (3 and 4) lead to faster initial increases in EGA.
* The lines representing αs = 3 and αs = 4 plateau earlier than those representing αs = 1 and αs = 2.
* The difference in EGA values between the lines diminishes as the Environment Step increases, suggesting convergence.
* There is a slight variation in the final EGA values achieved by each αs value, with αs = 2 reaching the highest value (approximately 0.98).
### Interpretation
The data suggests that the parameter αs significantly influences the rate at which EGA increases with respect to the Environment Step. Higher values of αs result in faster initial gains in EGA, but also lead to earlier saturation. This could indicate that there's a trade-off between the speed of learning/adaptation (represented by EGA) and the potential for further improvement. The convergence of the lines at higher Environment Steps suggests that, regardless of the initial αs value, the system eventually reaches a similar level of performance. The slight difference in the final EGA values might be due to inherent stochasticity in the system or other factors not represented in this chart. The chart demonstrates a learning curve, where performance (EGA) improves with experience (Environment Step), and the learning rate is modulated by the αs parameter.