## Line Graph: EGA Convergence Across Environment Steps
### Overview
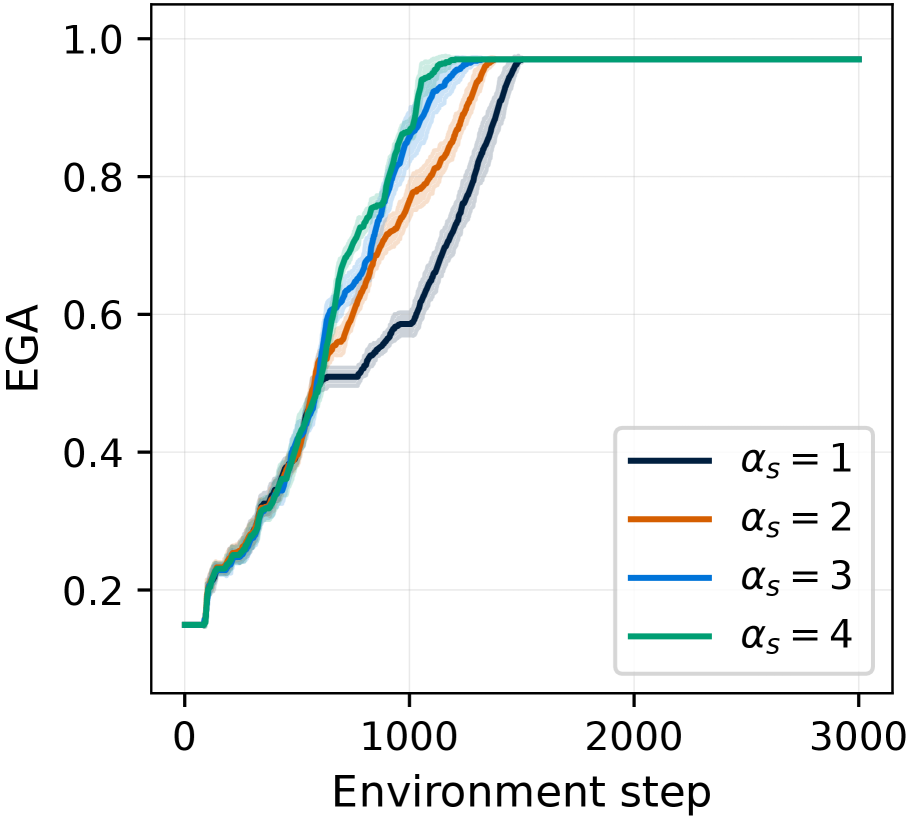
The image depicts a line graph illustrating the convergence of Expected Goal Achievement (EGA) across different environment steps for four distinct α_s values (1, 2, 3, 4). The graph shows four colored lines with shaded confidence intervals, all starting near 0.2 and converging toward 1.0 as environment steps increase.
### Components/Axes
- **X-axis**: "Environment step" (logarithmic scale, 0 to 3000)
- **Y-axis**: "EGA" (linear scale, 0.0 to 1.0)
- **Legend**: Located in the bottom-right corner, mapping colors to α_s values:
- Black: α_s = 1
- Orange: α_s = 2
- Blue: α_s = 3
- Green: α_s = 4
- **Shaded Regions**: Represent variability/confidence intervals around each line.
### Detailed Analysis
1. **Line Trends**:
- **α_s = 1 (Black)**: Starts at ~0.2, rises steeply to ~0.6 by 1000 steps, then plateaus. Confidence interval widest (~±0.15).
- **α_s = 2 (Orange)**: Begins at ~0.2, surpasses α_s=1 by ~500 steps, reaches ~0.8 by 1500 steps. Confidence interval narrower (~±0.10).
- **α_s = 3 (Blue)**: Starts at ~0.2, overtakes α_s=2 by ~1000 steps, reaches ~0.95 by 2000 steps. Confidence interval moderate (~±0.08).
- **α_s = 4 (Green)**: Highest initial slope, reaches ~0.98 by 1000 steps, plateaus at 1.0. Confidence interval narrowest (~±0.05).
2. **Convergence Patterns**:
- All lines converge to 1.0 by ~2000 steps, but α_s=4 achieves stability earliest (~1000 steps).
- Variability decreases with higher α_s values (green line has minimal shading).
### Key Observations
- Higher α_s values correlate with faster convergence and greater stability (narrower confidence intervals).
- α_s=1 exhibits the slowest convergence and highest uncertainty.
- Lines cross sequentially: α_s=2 > α_s=1 > α_s=3 > α_s=4 in early steps, but α_s=4 dominates after ~1000 steps.
### Interpretation
The data suggests that increasing α_s improves both the speed and reliability of EGA convergence. The green line (α_s=4) demonstrates optimal performance, achieving near-perfect EGA with minimal variability. This implies α_s=4 is the most efficient parameter setting for the modeled system. The shaded regions highlight the trade-off between exploration (wider intervals) and exploitation (narrower intervals) in reinforcement learning contexts. The logarithmic x-axis emphasizes early-stage performance differences, which are critical for parameter tuning.