## Line Chart: Model Accuracy vs. Training Steps
### Overview
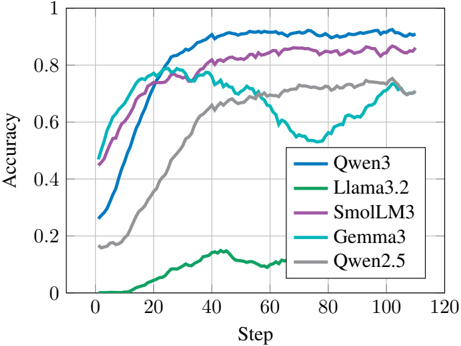
This image displays a line chart comparing the performance (Accuracy) of five different language models (Qwen3, Llama3.2, SmolLM3, Gemma3, and Qwen2.5) across a series of training steps. The chart tracks how accuracy evolves as the training progresses from step 0 to 120.
### Components/Axes
* **Y-Axis:** Labeled "Accuracy". The scale ranges from 0 to 1, with major grid lines at 0.2 intervals.
* **X-Axis:** Labeled "Step". The scale ranges from 0 to 120, with major grid lines at 20-step intervals.
* **Legend:** Located in the bottom-right quadrant of the chart area.
* **Blue line:** Qwen3
* **Green line:** Llama3.2
* **Purple line:** SmolLM3
* **Teal/Cyan line:** Gemma3
* **Grey line:** Qwen2.5
### Detailed Analysis
**1. Qwen3 (Blue Line)**
* **Trend:** Starts at approximately 0.25. It exhibits a steep, consistent upward trend until step 30, where it reaches ~0.8. It plateaus between 0.9 and 0.92 from step 40 through step 110.
* **Performance:** Highest overall accuracy.
**2. SmolLM3 (Purple Line)**
* **Trend:** Starts at approximately 0.45. It shows a steady, moderate upward slope. It crosses the 0.8 threshold around step 50 and maintains a plateau between 0.82 and 0.86 from step 60 onwards.
* **Performance:** Second highest overall accuracy.
**3. Gemma3 (Teal Line)**
* **Trend:** Starts at approximately 0.48. It rises quickly to a local peak of ~0.78 at step 30. Following this, it exhibits a significant decline (a "dip") between step 35 and step 75, dropping to a low of ~0.53. It then recovers, rising back to ~0.75 by step 105.
* **Performance:** Highly volatile; demonstrates instability compared to other models.
**4. Qwen2.5 (Grey Line)**
* **Trend:** Starts at approximately 0.18. It shows a steady, linear-like growth throughout the training process. It reaches ~0.6 at step 45 and plateaus between 0.72 and 0.75 after step 90.
* **Performance:** Stable, moderate performance.
**5. Llama3.2 (Green Line)**
* **Trend:** Starts at 0. It remains flat at 0 until approximately step 15. It then shows a very slow, shallow upward trend, peaking at ~0.15 at step 45. It dips slightly and ends at approximately 0.12.
* **Performance:** Significantly underperforming compared to the other four models.
### Key Observations
* **Dominance:** Qwen3 is the clear top performer, achieving the highest accuracy and the fastest convergence.
* **Instability:** Gemma3 is the only model that shows a significant performance regression (the dip between steps 35 and 75), suggesting potential issues with training stability, catastrophic forgetting, or a phase transition in the learning process.
* **Failure to Converge:** Llama3.2 shows negligible learning progress compared to the other models, suggesting it may be incompatible with the task or training parameters used in this experiment.
* **Consistency:** SmolLM3 and Qwen2.5 demonstrate the most stable, predictable learning curves.
### Interpretation
The data suggests a significant disparity in how these specific models handle the task being measured.
* **Qwen3** appears to be the most optimized for this task, reaching near-optimal accuracy quickly.
* **Gemma3's** "U-shaped" curve is the most notable anomaly. In machine learning contexts, such a dip often indicates that the model initially learned a shortcut or a specific pattern that became invalid as training continued, forcing the model to "unlearn" and then re-learn the task, or it could indicate a hyperparameter issue (e.g., learning rate) that caused instability mid-training.
* **Llama3.2's** near-zero performance suggests that either the model is not suited for this specific task, or there is a fundamental mismatch in the training configuration (e.g., input format, tokenization, or objective function) that prevents it from learning effectively.