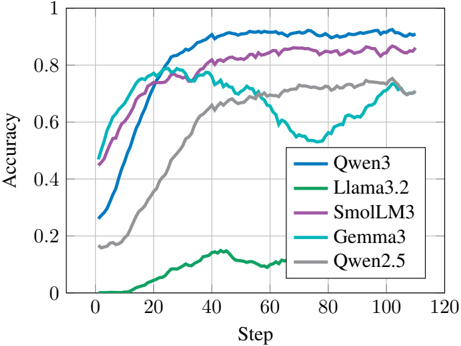
## Line Graph: Model Accuracy Over Training Steps
### Overview
The image is a line graph comparing the accuracy of five machine learning models (Qwen3, Llama3.2, SmolLM3, Gemma3, Qwen2.5) across 120 training steps. Accuracy is measured on a scale from 0 to 1, with steps increasing in increments of 20. The graph highlights performance trends, including convergence rates, plateaus, and anomalies.
### Components/Axes
- **X-axis (Step)**: Labeled "Step" with markers at 0, 20, 40, 60, 80, 100, 120.
- **Y-axis (Accuracy)**: Labeled "Accuracy" with markers at 0, 0.2, 0.4, 0.6, 0.8, 1.0.
- **Legend**: Located in the bottom-right corner, mapping colors to models:
- Blue: Qwen3
- Green: Llama3.2
- Purple: SmolLM3
- Cyan: Gemma3
- Gray: Qwen2.5
### Detailed Analysis
1. **Qwen3 (Blue)**:
- Starts at ~0.3 accuracy at step 0.
- Rises sharply to ~0.9 by step 40.
- Plateaus near 0.9 for the remainder of the steps.
2. **Llama3.2 (Green)**:
- Begins near 0 accuracy at step 0.
- Gradually increases to ~0.7 by step 40.
- Drops to ~0.5 by step 60, then stabilizes.
3. **SmolLM3 (Purple)**:
- Starts at ~0.4 accuracy at step 0.
- Rises steadily to ~0.85 by step 40.
- Maintains ~0.85 accuracy through step 120.
4. **Gemma3 (Cyan)**:
- Begins at ~0.5 accuracy at step 0.
- Peaks at ~0.75 by step 40.
- Drops to ~0.55 at step 60, then recovers to ~0.7 by step 100.
5. **Qwen2.5 (Gray)**:
- Starts at ~0.2 accuracy at step 0.
- Gradually increases to ~0.7 by step 100.
- Shows minimal change after step 100.
### Key Observations
- **Highest Performance**: Qwen3 and SmolLM3 achieve the highest accuracy (~0.9 and ~0.85, respectively) by step 40.
- **Anomalies**:
- Llama3.2 exhibits a sharp drop in accuracy after step 40.
- Gemma3 shows a significant dip at step 60 (~0.55) before recovering.
- **Slowest Convergence**: Qwen2.5 has the slowest improvement, reaching ~0.7 accuracy only by step 100.
### Interpretation
The data suggests that **Qwen3** and **SmolLM3** are the most efficient models, achieving high accuracy rapidly. **Llama3.2** and **Gemma3** display instability, with Llama3.2’s post-step-40 drop and Gemma3’s mid-training dip indicating potential overfitting or optimization issues. **Qwen2.5**’s slow but steady rise implies reliability but inefficiency. The graph underscores trade-offs between speed and stability in model training, with Qwen3 emerging as the optimal performer in this dataset.