\n
## Histogram: Distribution of Thinking Tokens
### Overview
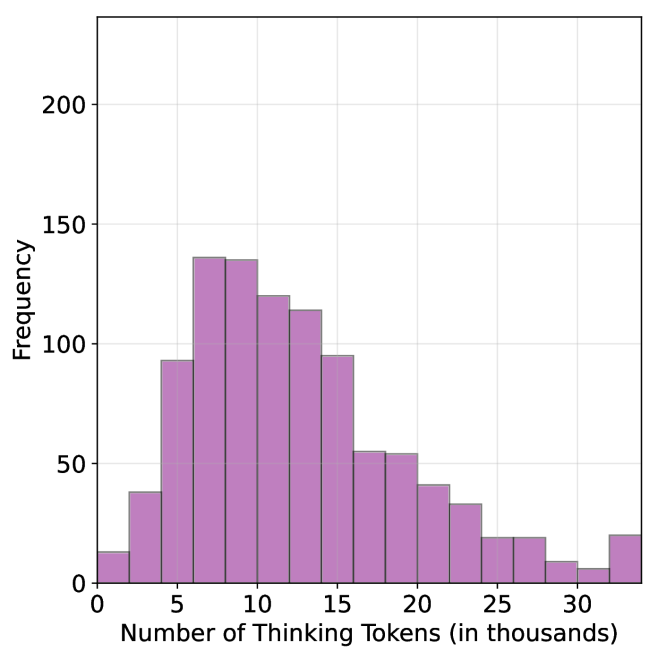
The image presents a histogram visualizing the frequency distribution of "Thinking Tokens" measured in thousands. The data appears to be right-skewed, with a concentration of values between 5 and 15 thousand tokens.
### Components/Axes
* **X-axis Title:** "Number of Thinking Tokens (in thousands)"
* Scale: Ranges from 0 to 30 (in thousands).
* Markers: 0, 5, 10, 15, 20, 25, 30.
* **Y-axis Title:** "Frequency"
* Scale: Ranges from 0 to 200.
* Markers: 0, 50, 100, 150, 200.
* **Histogram Bars:** Filled with a light purple color.
### Detailed Analysis
The histogram shows the distribution of the number of thinking tokens. The highest frequency occurs between 8 and 12 thousand tokens, with a frequency of approximately 145. The distribution decreases as the number of tokens increases beyond 12 thousand, and also decreases as the number of tokens decreases below 8 thousand.
Here's a breakdown of approximate frequency values for each bin:
* 0-5 thousand tokens: Frequency ≈ 30
* 5-10 thousand tokens: Frequency ≈ 145
* 10-15 thousand tokens: Frequency ≈ 125
* 15-20 thousand tokens: Frequency ≈ 80
* 20-25 thousand tokens: Frequency ≈ 35
* 25-30 thousand tokens: Frequency ≈ 15
### Key Observations
* The distribution is not symmetrical; it is right-skewed. This indicates that a larger proportion of observations fall within the lower range of thinking tokens, while fewer observations have a higher number of tokens.
* The peak frequency is around 9-11 thousand tokens.
* There is a noticeable drop in frequency after 15 thousand tokens.
* The data is discrete, represented by bins.
### Interpretation
The data suggests that the majority of instances involve a relatively low number of "Thinking Tokens" (between 5 and 15 thousand). The right skewness implies that while most instances have a lower token count, there are some instances with significantly higher token counts, potentially representing more complex or prolonged thought processes. The concept of "Thinking Tokens" is not defined within the image, but it could represent a unit of computational effort, time spent processing information, or some other measure of cognitive activity. The distribution could be used to understand the typical cognitive load or processing requirements of a system or task. The relatively small number of observations with high token counts might indicate that these are rare or exceptional cases. Further investigation would be needed to understand the meaning of "Thinking Tokens" and the context in which this data was collected.