## Box Plot: Model Performance vs. Human Performance
### Overview
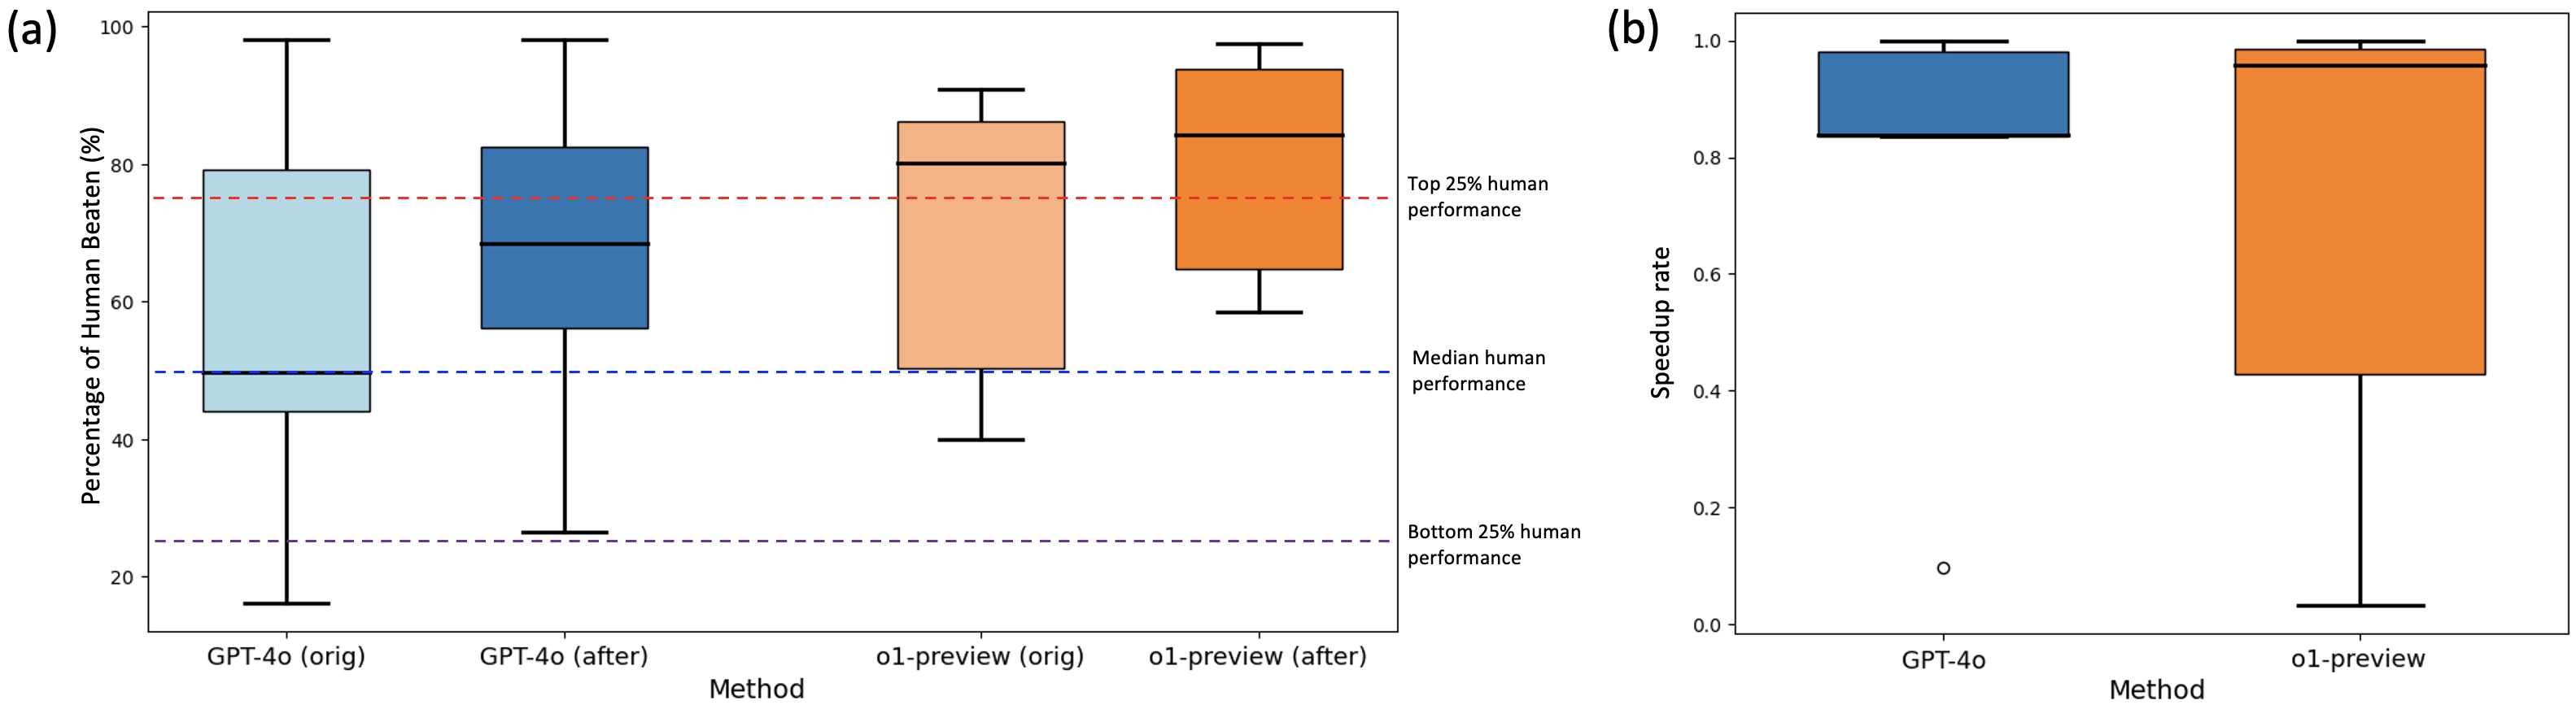
The image presents two box plots, (a) and (b), comparing the performance of different models (GPT-4o and o1-preview) against human performance. Plot (a) shows the percentage of times the models "beat" humans, while plot (b) shows the speedup rate. The models are evaluated in their original and "after" versions. Horizontal dashed lines indicate human performance benchmarks (top 25%, median, and bottom 25%).
### Components/Axes
**Plot (a): Percentage of Human Beaten**
* **Y-axis:** "Percentage of Human Beaten (%)", ranging from 0 to 100.
* **X-axis:** "Method", with four categories: "GPT-4o (orig)", "GPT-4o (after)", "o1-preview (orig)", and "o1-preview (after)".
* **Box Plot Colors:**
* GPT-4o (orig) and GPT-4o (after) are shades of blue.
* o1-preview (orig) and o1-preview (after) are shades of orange.
* **Horizontal Dashed Lines:**
* Red: "Top 25% human performance" (approximately at 75%).
* Blue: "Median human performance" (approximately at 50%).
* Purple: "Bottom 25% human performance" (approximately at 25%).
**Plot (b): Speedup Rate**
* **Y-axis:** "Speedup rate", ranging from 0.0 to 1.0.
* **X-axis:** "Method", with two categories: "GPT-4o" and "o1-preview".
* **Box Plot Colors:**
* GPT-4o is blue.
* o1-preview is orange.
### Detailed Analysis
**Plot (a): Percentage of Human Beaten**
* **GPT-4o (orig) (Light Blue):**
* Minimum: ~17%
* First Quartile (Q1): ~45%
* Median: ~48%
* Third Quartile (Q3): ~78%
* Maximum: ~98%
* **GPT-4o (after) (Dark Blue):**
* Minimum: ~25%
* First Quartile (Q1): ~55%
* Median: ~68%
* Third Quartile (Q3): ~82%
* Maximum: ~98%
* **o1-preview (orig) (Light Orange):**
* Minimum: ~40%
* First Quartile (Q1): ~70%
* Median: ~80%
* Third Quartile (Q3): ~85%
* Maximum: ~90%
* **o1-preview (after) (Dark Orange):**
* Minimum: ~58%
* First Quartile (Q1): ~78%
* Median: ~85%
* Third Quartile (Q3): ~92%
* Maximum: ~98%
**Plot (b): Speedup Rate**
* **GPT-4o (Blue):**
* Outlier: ~0.1
* Minimum: ~0.83
* First Quartile (Q1): ~0.84
* Median: ~0.92
* Third Quartile (Q3): ~0.98
* Maximum: ~1.0
* **o1-preview (Orange):**
* Minimum: ~0.02
* First Quartile (Q1): ~0.42
* Median: ~0.95
* Third Quartile (Q3): ~0.98
* Maximum: ~1.0
### Key Observations
* In plot (a), both GPT-4o and o1-preview show an increase in the percentage of times they beat humans after the "after" version.
* The o1-preview models generally outperform the GPT-4o models in terms of the percentage of times they beat humans.
* In plot (b), GPT-4o has a consistently high speedup rate, while o1-preview has a wider range of speedup rates, including a very low minimum value.
### Interpretation
The data suggests that the "after" versions of both models (GPT-4o and o1-preview) show improved performance compared to their original versions in terms of beating human performance. The o1-preview models appear to be more effective at beating humans than the GPT-4o models. However, when considering the speedup rate, GPT-4o demonstrates a more consistent and generally high speedup, while o1-preview's speedup rate varies significantly, indicating potential instability or variability in its performance. The outlier in the GPT-4o speedup rate suggests a possible anomaly in the data. The horizontal lines representing human performance benchmarks provide a context for evaluating the models' capabilities relative to human abilities.