## Box Plot & Bar Chart: Human vs. AI Performance
### Overview
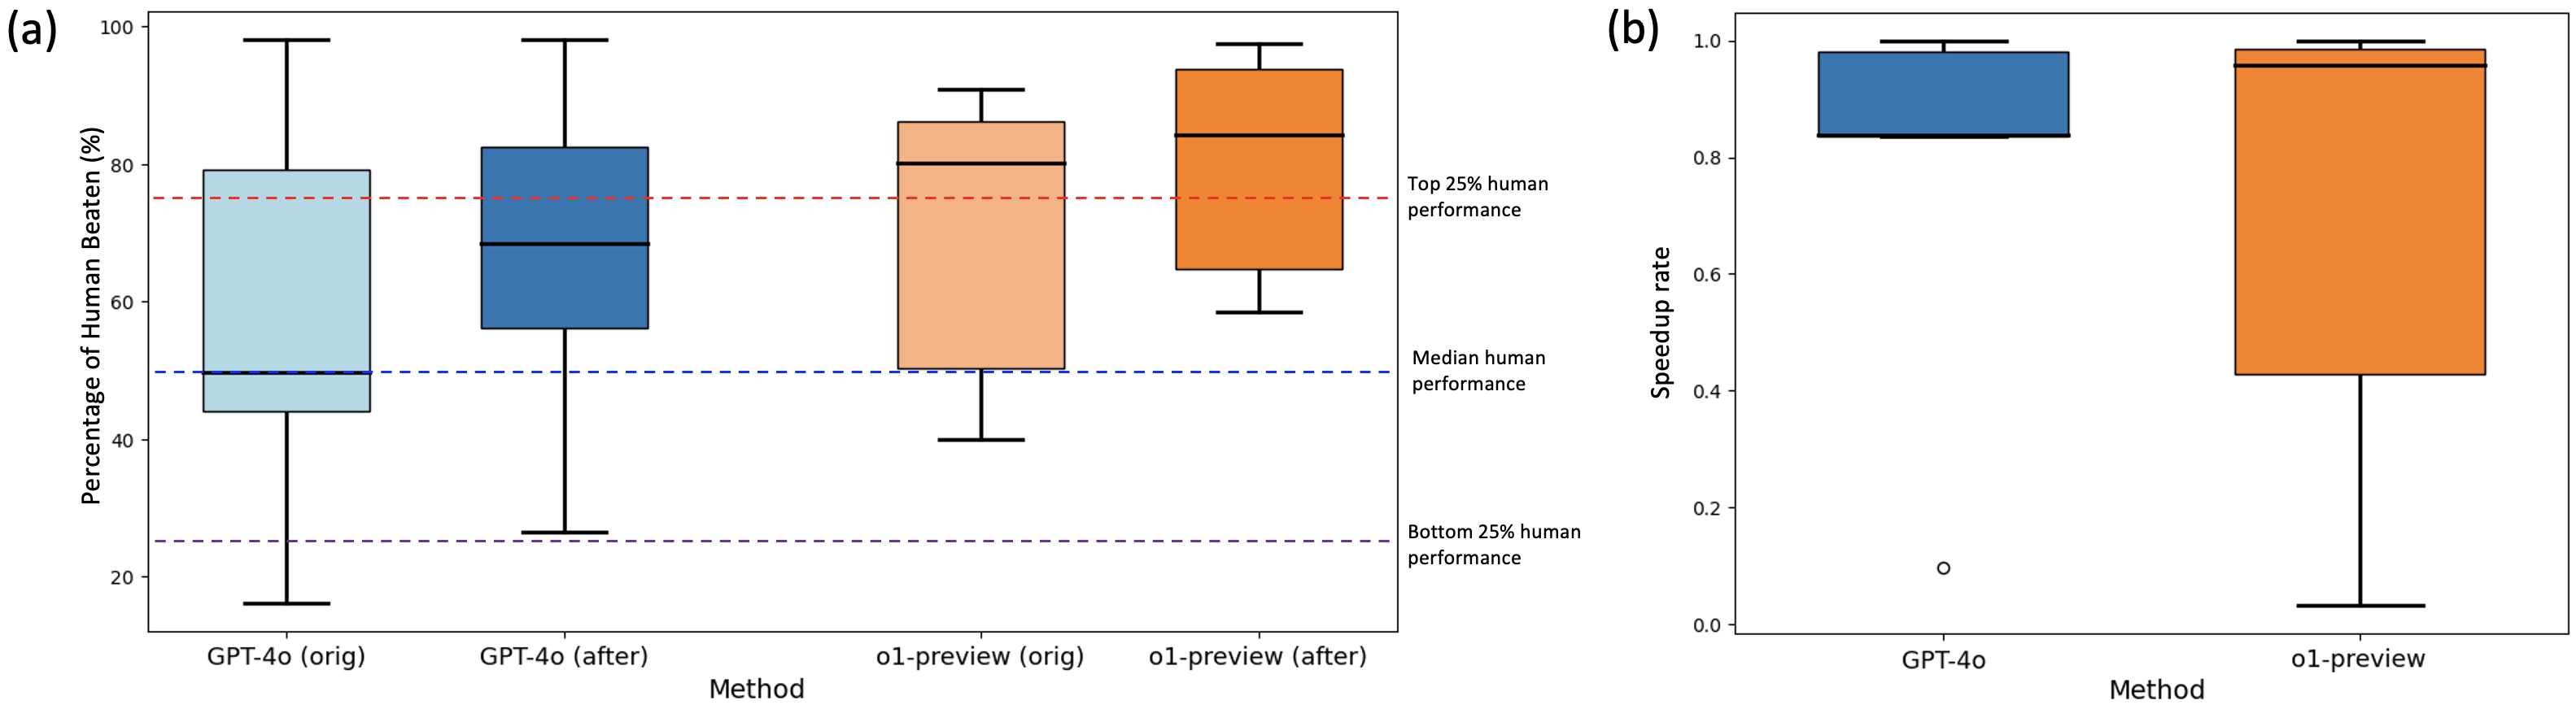
The image presents two charts: (a) a box plot comparing the percentage of times a method is "beaten" by humans, and (b) a bar chart showing the speedup rate of different methods. The methods compared are GPT-4o (original), GPT-4o (after), o1-preview (original), and o1-preview (after). The box plot includes reference lines for the top 25%, median, and bottom 25% of human performance.
### Components/Axes
**Chart (a):**
* **X-axis:** Method (GPT-4o (orig), GPT-4o (after), o1-preview (orig), o1-preview (after))
* **Y-axis:** Percentage of Human Beaten (%) - Scale ranges from 0 to 100.
* **Box Plot Elements:** Each box represents the interquartile range (IQR), with a line indicating the median. Whiskers extend to show the range of the data, excluding outliers. Outliers are represented as individual points.
* **Horizontal Lines:**
* Top 25% human performance: Dashed red line at approximately 75%.
* Median human performance: Dashed red line at approximately 50%.
* Bottom 25% human performance: Dashed red line at approximately 25%.
**Chart (b):**
* **X-axis:** Method (GPT-4o, o1-preview)
* **Y-axis:** Speedup rate - Scale ranges from 0 to 1.2.
* **Bar Chart Elements:** Each bar represents the average speedup rate for a given method. Error bars indicate the variability of the data.
### Detailed Analysis or Content Details
**Chart (a): Percentage of Human Beaten**
* **GPT-4o (orig):** The box plot shows a median around 40%, IQR from approximately 25% to 60%, and whiskers extending down to approximately 10%. There are a few outliers below 10%.
* **GPT-4o (after):** The box plot shows a median around 70%, IQR from approximately 55% to 85%, and whiskers extending down to approximately 30% and up to approximately 95%.
* **o1-preview (orig):** The box plot shows a median around 50%, IQR from approximately 35% to 70%, and whiskers extending down to approximately 15% and up to approximately 90%.
* **o1-preview (after):** The box plot shows a median around 85%, IQR from approximately 70% to 95%, and whiskers extending down to approximately 50% and up to approximately 100%.
**Chart (b): Speedup Rate**
* **GPT-4o:** The bar shows a speedup rate of approximately 1.0, with an error bar extending from approximately 0.9 to 1.1.
* **o1-preview:** The bar shows a speedup rate of approximately 1.0, with an error bar extending from approximately 0.8 to 1.2.
### Key Observations
* The "after" versions of both GPT-4o and o1-preview significantly outperform their "original" counterparts in terms of the percentage of times they beat humans.
* The median human performance is around 50%, and the "after" versions of both models exceed this benchmark.
* The speedup rate is approximately 1.0 for both methods, indicating no significant speed difference.
### Interpretation
The data suggests that applying a certain update ("after" versions) substantially improves the performance of both GPT-4o and o1-preview, bringing them closer to or exceeding human-level performance as measured by the percentage of times they are "beaten" by humans. The speedup rate remaining constant indicates that the performance improvement does not come at the cost of increased processing time.
The horizontal lines representing human performance provide a clear benchmark. The "original" versions of both models fall below the median human performance, while the "after" versions surpass it. The box plot visualization effectively demonstrates the distribution of performance across multiple trials, highlighting the consistency and range of results for each method. The error bars in the speedup rate chart indicate some variability in the speedup achieved, but the overall trend suggests no significant difference in processing speed between the two methods.
The use of box plots is appropriate for visualizing the distribution of the percentage of human beaten, allowing for a comparison of central tendency, spread, and outliers. The bar chart is suitable for presenting the speedup rate, providing a clear comparison of the efficiency of the two methods.