## Box Plot Comparison: AI Model Performance vs. Human Benchmarks and Speedup Rates
### Overview
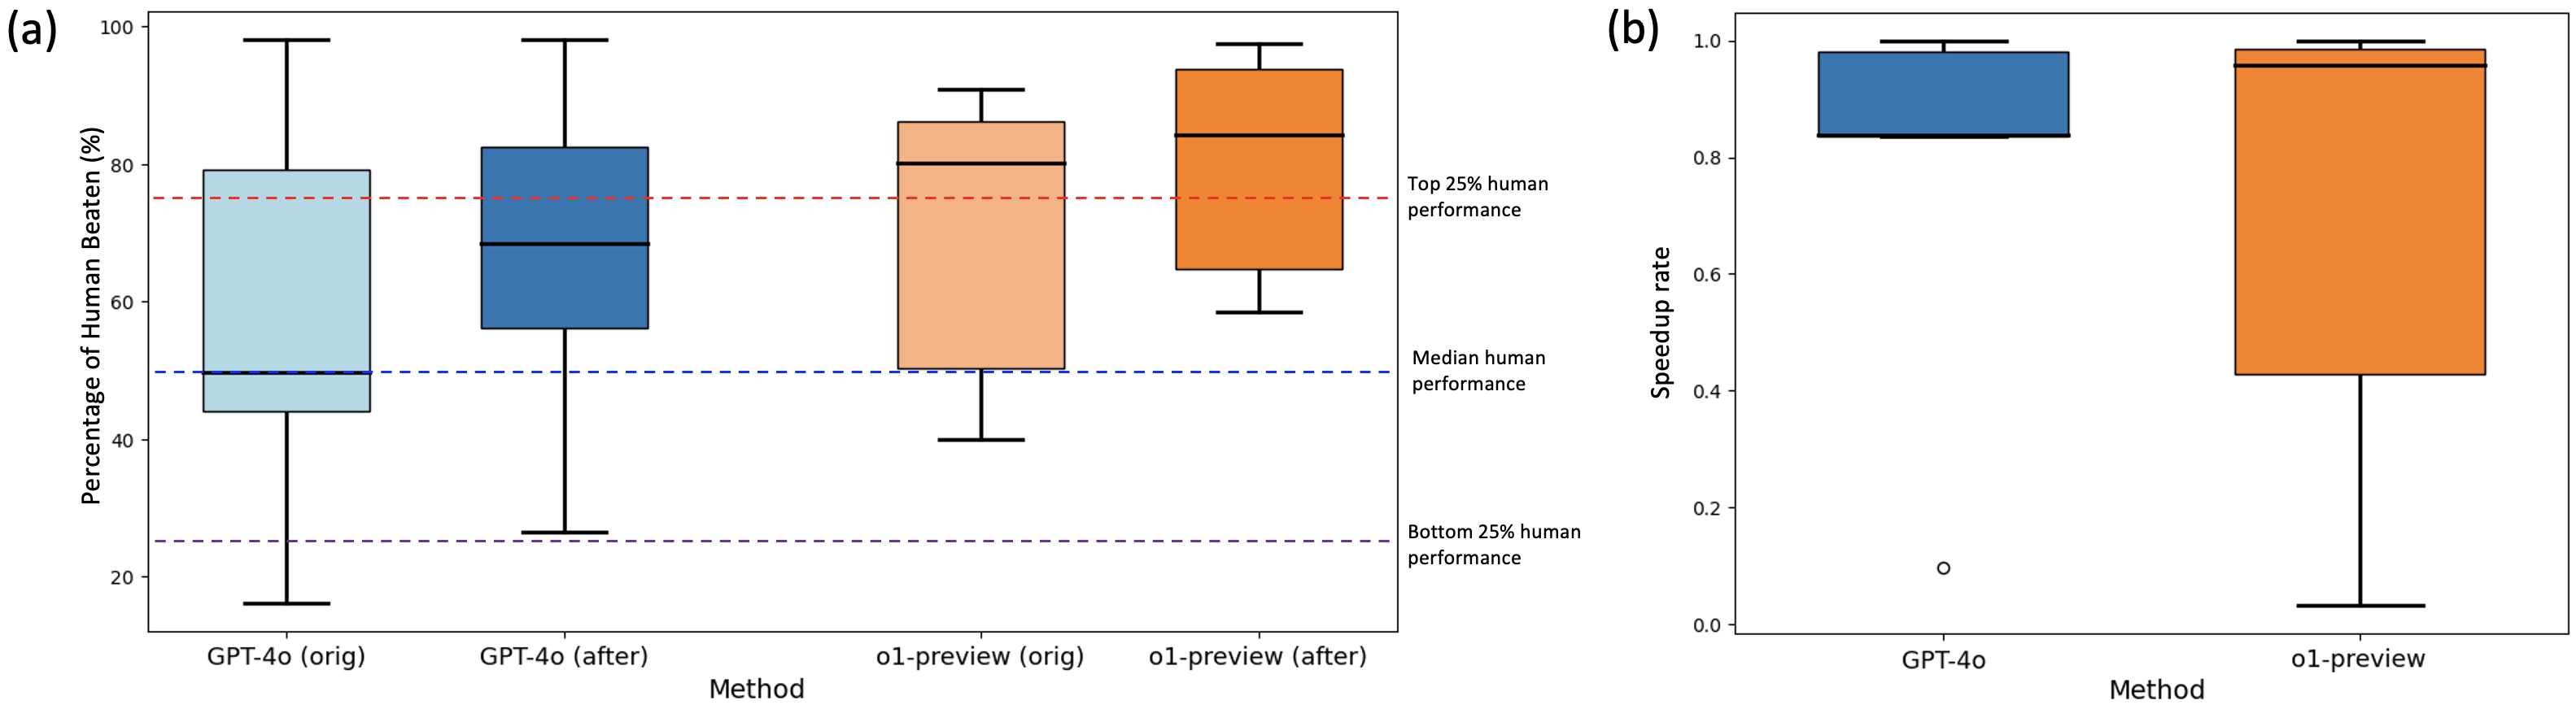
The image displays two side-by-side box plots, labeled (a) and (b), comparing the performance of two AI models (GPT-4o and o1-preview) across different conditions. Plot (a) measures performance as a "Percentage of Human Beaten," while plot (b) measures a "Speedup rate." The plots use color-coding to distinguish between model versions and conditions.
### Components/Axes
**Plot (a) - Left Panel:**
* **Title/Label:** (a)
* **Y-axis:** Label: "Percentage of Human Beaten (%)". Scale ranges from 0 to 100 with major ticks at 20, 40, 60, 80, 100.
* **X-axis:** Label: "Method". Four categories are listed:
1. `GPT-4o (orig)` - Light blue box.
2. `GPT-4o (after)` - Darker blue box.
3. `o1-preview (orig)` - Light orange/peach box.
4. `o1-preview (after)` - Darker orange box.
* **Reference Lines (Horizontal Dashed):**
* **Red Dashed Line:** Positioned at approximately 75%. Label (right side): "Top 25% human performance".
* **Blue Dashed Line:** Positioned at 50%. Label (right side): "Median human performance".
* **Purple Dashed Line:** Positioned at approximately 25%. Label (right side): "Bottom 25% human performance".
**Plot (b) - Right Panel:**
* **Title/Label:** (b)
* **Y-axis:** Label: "Speedup rate". Scale ranges from 0.0 to 1.0 with major ticks at 0.0, 0.2, 0.4, 0.6, 0.8, 1.0.
* **X-axis:** Label: "Method". Two categories are listed:
1. `GPT-4o` - Blue box.
2. `o1-preview` - Orange box.
### Detailed Analysis
**Plot (a) - Percentage of Human Beaten:**
* **Trend Verification:** Moving from left to right, the median performance (central line within each box) shows a clear upward trend. The "after" condition for each model shows higher performance than its "orig" counterpart. The o1-preview models generally perform higher than the GPT-4o models.
* **Data Points (Approximate Values):**
* **GPT-4o (orig):** Median ≈ 50%. Interquartile Range (IQR, box) ≈ 44% to 79%. Whiskers extend from ≈ 16% to ≈ 98%.
* **GPT-4o (after):** Median ≈ 68%. IQR ≈ 56% to 82%. Whiskers extend from ≈ 26% to ≈ 98%.
* **o1-preview (orig):** Median ≈ 80%. IQR ≈ 50% to 86%. Whiskers extend from ≈ 40% to ≈ 91%.
* **o1-preview (after):** Median ≈ 84%. IQR ≈ 64% to 94%. Whiskers extend from ≈ 58% to ≈ 98%.
* **Relation to Benchmarks:** The median for `GPT-4o (orig)` aligns with the "Median human performance" line (50%). The median for `GPT-4o (after)` is above the median human line but below the top 25% line. Both `o1-preview` variants have medians above the "Top 25% human performance" line (75%).
**Plot (b) - Speedup Rate:**
* **Trend Verification:** The `o1-preview` box plot shows a much wider distribution and a lower median compared to the tightly clustered, high-value `GPT-4o` plot.
* **Data Points (Approximate Values):**
* **GPT-4o:** Median ≈ 0.98. IQR is very narrow, from ≈ 0.83 to ≈ 0.98. The upper whisker reaches 1.0. There is one low outlier at ≈ 0.1.
* **o1-preview:** Median ≈ 0.95. IQR is very wide, from ≈ 0.42 to ≈ 0.98. The upper whisker reaches 1.0, and the lower whisker extends down to ≈ 0.03.
### Key Observations
1. **Performance Improvement:** Both models show a significant increase in the "Percentage of Human Beaten" from the "orig" to the "after" condition, suggesting an effective enhancement or optimization.
2. **Model Superiority:** The `o1-preview` model, especially in the "after" condition, consistently outperforms `GPT-4o` on the performance metric, with its entire interquartile range sitting above the top 25% human benchmark.
3. **Speed-Performance Trade-off:** While `o1-preview` achieves higher performance scores (plot a), its speedup rate (plot b) is highly variable and can be very low. In contrast, `GPT-4o` maintains a consistently high speedup rate near 1.0, with only one outlier.
4. **Variability:** The `o1-preview` model exhibits greater variability in both metrics, particularly in speedup rate, where its IQR spans almost the entire scale.
### Interpretation
The data suggests a clear trade-off between peak performance and consistent speed. The `o1-preview` model represents a higher-capability system, able to beat a larger percentage of humans (often exceeding the top 25% benchmark), but this comes at the cost of unpredictable and sometimes drastically slower speedup rates. The `GPT-4o` model, while not reaching the same performance heights, offers reliable and fast processing.
The "orig" to "after" improvement indicates successful tuning or prompting strategies that boost performance without a visible cost in this specific visualization. The presence of human performance benchmarks contextualizes the AI's capabilities, showing that advanced models can now routinely surpass median human performance and frequently exceed the top quartile on the evaluated tasks. The outlier for `GPT-4o` in the speedup plot is notable, indicating a rare case of severe slowdown.