\n
## Scatter Plot: Model Performance vs. Computational Cost
### Overview
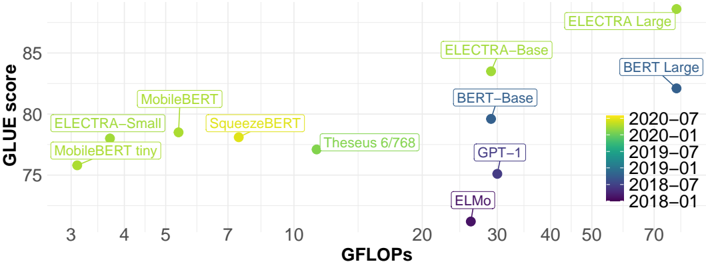
The image is a scatter plot comparing the performance of various natural language processing (NLP) models on the GLUE benchmark against their computational cost measured in GFLOPs (Giga Floating Point Operations). The plot visualizes the trade-off between model accuracy and efficiency. Each data point represents a specific model, labeled with its name and colored according to its publication or release date.
### Components/Axes
* **X-Axis (Horizontal):** Labeled **"GFLOPs"**. It uses a **logarithmic scale** with major tick marks at 3, 4, 5, 7, 10, 20, 30, 40, 50, and 70. This axis represents computational cost or model size.
* **Y-Axis (Vertical):** Labeled **"GLUE score"**. It uses a linear scale with major tick marks at 75, 80, and 85. This axis represents model performance on the GLUE benchmark.
* **Legend:** Located on the right side of the chart. It is a vertical color bar mapping colors to dates in `YYYY-MM` format. The dates, from bottom to top, are:
* 2018-01 (Dark Purple)
* 2018-07 (Purple)
* 2019-01 (Blue)
* 2019-07 (Teal)
* 2020-01 (Green)
* 2020-07 (Yellow-Green)
* **Data Points:** Each point is a circle with an associated text label. The color of the circle corresponds to the date in the legend.
### Detailed Analysis
The following table lists each model, its approximate position on the chart (GFLOPs, GLUE score), and its associated date color. Values are approximate based on visual inspection of the logarithmic x-axis.
| Model Label | Approx. GFLOPs | Approx. GLUE Score | Legend Color (Date) |
| :--- | :--- | :--- | :--- |
| MobileBERT tiny | ~3 | ~76 | Green (2020-01) |
| ELECTRA-Small | ~3.5 | ~78 | Yellow-Green (2020-07) |
| MobileBERT | ~5 | ~79 | Green (2020-01) |
| SqueezeBERT | ~7 | ~78 | Yellow-Green (2020-07) |
| Theseus 6/768 | ~12 | ~77 | Green (2020-01) |
| ELMo | ~25 | ~72 | Dark Purple (2018-01) |
| GPT-1 | ~30 | ~75 | Purple (2018-07) |
| BERT-Base | ~30 | ~80 | Blue (2019-01) |
| ELECTRA-Base | ~30 | ~84 | Yellow-Green (2020-07) |
| BERT Large | ~70 | ~82 | Blue (2019-01) |
| ELECTRA Large | ~70 | ~86 | Yellow-Green (2020-07) |
**Trend Verification:**
* **General Trend:** There is a broad, positive correlation where models with higher GFLOPs (further right) tend to have higher GLUE scores (higher up). However, the relationship is not perfectly linear, and significant efficiency differences exist.
* **Efficiency Frontier:** The ELECTRA family of models (Small, Base, Large) consistently appears at the upper-left boundary of the data cluster for their respective computational cost tiers, indicating a favorable performance-to-cost ratio.
* **Outliers:** ELMo and GPT-1 are notable outliers. They have relatively high GFLOPs (~25-30) but achieve lower GLUE scores (~72-75) compared to more recent models at similar or even lower computational costs (e.g., BERT-Base at ~30 GFLOPs scores ~80).
### Key Observations
1. **Temporal Progression:** The color coding reveals a clear trend over time. Older models (purples/blues, 2018-2019) like ELMo, GPT-1, and BERT generally occupy positions with lower scores for their cost. Newer models (greens/yellow-greens, 2020) like the ELECTRA and MobileBERT families achieve higher scores, often at lower or comparable GFLOPs.
2. **Model Family Clustering:** Models from the same family (e.g., ELECTRA-Small, Base, Large) form a clear progression, showing how scaling up model size (increasing GFLOPs) leads to higher GLUE scores.
3. **Efficiency Variance:** At similar computational budgets, performance can vary widely. For example, at ~30 GFLOPs, models range from GPT-1 (~75) to ELECTRA-Base (~84).
### Interpretation
This chart effectively illustrates the rapid advancement in NLP model efficiency between 2018 and 2020. The data suggests that architectural innovations (like those in ELECTRA) yielded more significant performance gains per GFLOP than simply scaling older architectures (like BERT or GPT-1).
The **ELECTRA models** demonstrate a particularly strong Pareto efficiency, meaning they offer the best known performance for a given computational budget within this dataset. The **MobileBERT** variants also show strong efficiency, achieving respectable scores with very low GFLOPs, making them suitable for resource-constrained environments.
The poor performance of **ELMo** and **GPT-1** relative to their cost highlights the impact of the paradigm shift towards more efficient pre-training objectives and architectures that occurred around 2019-2020. The chart serves as a snapshot of a field where achieving higher accuracy was increasingly tied not just to more computation, but to smarter model design.