## Bar Chart: Generative Accuracy by Number of Generalizations and Prompt Condition
### Overview
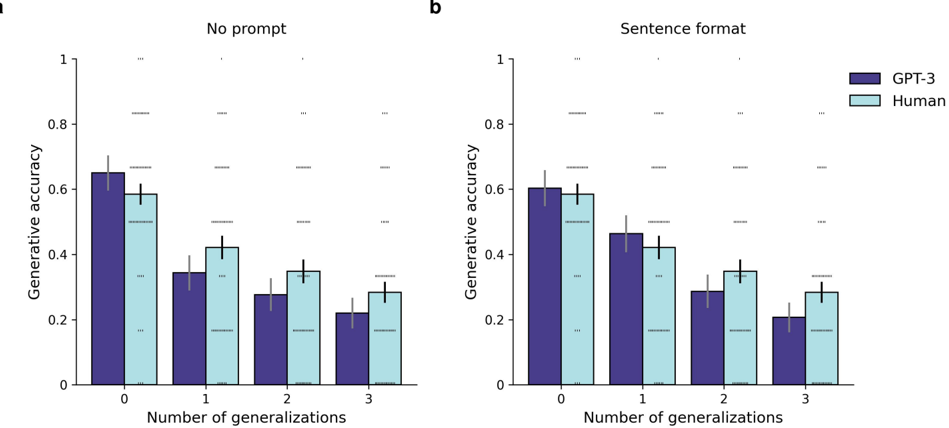
The image displays two side-by-side bar charts (labeled **a** and **b**) comparing the "Generative accuracy" of two entities—**GPT-3** and **Human**—across four levels of task complexity, defined by the "Number of generalizations" (0, 1, 2, 3). The left chart (a) shows results under a "No prompt" condition, while the right chart (b) shows results under a "Sentence format" prompt condition. Both charts share identical axes and a common legend.
### Components/Axes
* **Titles:**
* Chart a (left): "No prompt"
* Chart b (right): "Sentence format"
* **Y-axis (Vertical):** Label: "Generative accuracy". Scale: Linear from 0 to 1, with major tick marks at 0, 0.2, 0.4, 0.6, 0.8, and 1.
* **X-axis (Horizontal):** Label: "Number of generalizations". Categories: 0, 1, 2, 3.
* **Legend:** Located in the top-right corner of chart b.
* **GPT-3:** Dark purple bar.
* **Human:** Light blue bar.
* **Visual Elements:**
* Each data point is represented by a vertical bar with a black error bar extending from its top.
* In the background of both charts, there are several horizontal, gray, dashed lines at various y-values (approximately at 0.17, 0.33, 0.50, 0.67, 0.83). These likely represent statistical significance thresholds or benchmark levels, but are not labeled.
### Detailed Analysis
**Chart a: No prompt**
* **Trend:** For both GPT-3 and Human, generative accuracy decreases as the number of generalizations increases.
* **Data Points (Approximate Values):**
* **0 Generalizations:** GPT-3 ≈ 0.65, Human ≈ 0.60.
* **1 Generalization:** GPT-3 ≈ 0.35, Human ≈ 0.42.
* **2 Generalizations:** GPT-3 ≈ 0.28, Human ≈ 0.35.
* **3 Generalizations:** GPT-3 ≈ 0.22, Human ≈ 0.28.
**Chart b: Sentence format**
* **Trend:** Similar downward trend for both entities as generalizations increase.
* **Data Points (Approximate Values):**
* **0 Generalizations:** GPT-3 ≈ 0.60, Human ≈ 0.58.
* **1 Generalization:** GPT-3 ≈ 0.46, Human ≈ 0.42.
* **2 Generalizations:** GPT-3 ≈ 0.29, Human ≈ 0.35.
* **3 Generalizations:** GPT-3 ≈ 0.21, Human ≈ 0.28.
### Key Observations
1. **Performance Decline:** The most prominent pattern is a consistent decline in accuracy for both GPT-3 and humans as the task requires more generalizations (from 0 to 3).
2. **Prompt Effect:** The "Sentence format" prompt appears to alter the performance gap between GPT-3 and humans, particularly at lower generalization counts.
* At **0 generalizations**, GPT-3's accuracy is slightly higher than Human in the "No prompt" condition, but they are nearly equal in the "Sentence format" condition.
* At **1 generalization**, GPT-3's accuracy is lower than Human in the "No prompt" condition, but higher than Human in the "Sentence format" condition.
3. **Convergence at High Complexity:** At 2 and 3 generalizations, the performance of GPT-3 and humans is relatively similar in both prompt conditions, with humans maintaining a slight edge.
4. **Error Bars:** The presence of error bars on all data points indicates measured variability or confidence intervals around the mean accuracy scores.
### Interpretation
This data suggests a core finding: **the ability to generalize degrades for both artificial (GPT-3) and human intelligence as the number of required generalizations increases.** The task becomes fundamentally harder with added layers of abstraction.
The comparison between the "No prompt" and "Sentence format" conditions provides a nuanced view of how prompting affects model performance relative to humans. The "Sentence format" prompt seems to **modulate the performance differential**. It narrows the gap at the simplest task (0 generalizations) and reverses the gap at one generalization, where GPT-3 outperforms humans. This implies that the format of the instruction can significantly impact how effectively a model like GPT-3 applies its capabilities, sometimes bringing it closer to or even surpassing human baseline performance on specific sub-tasks.
The converging performance at higher generalization counts (2 and 3) suggests a potential **ceiling effect** or a common bottleneck in complex reasoning that affects both biological and artificial systems similarly. The unlabeled dashed lines hint at a statistical framework for evaluating these differences, but without their explicit meaning, we can only infer they mark thresholds for significant performance levels. Overall, the charts illustrate that while raw capability (like GPT-3's at 0 generalizations) can be high, the robustness of that capability across increasingly complex, multi-step reasoning tasks is a critical differentiator, and one where human and model performance can be sensitive to contextual factors like prompt design.