# Technical Document Extraction: Histogram Analysis
## 1. Labels and Axis Information
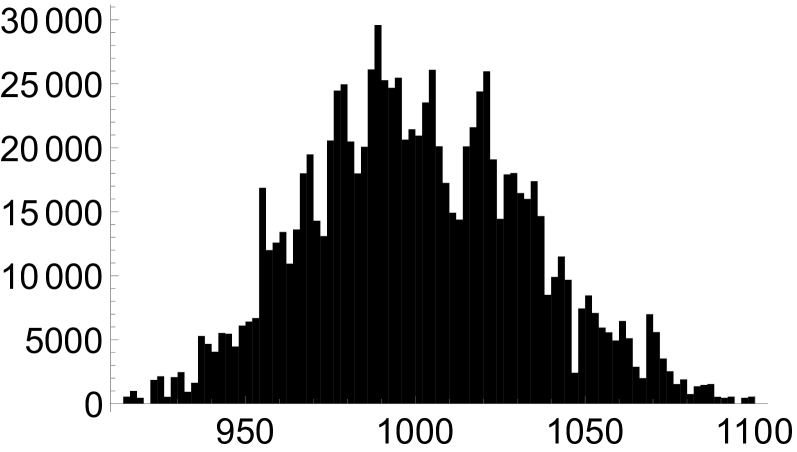
- **Title**: "Distribution of Values"
- **Vertical Axis (Y-axis)**:
- Label: "Frequency"
- Range: 0 to 30,000
- Increment: 5,000
- **Horizontal Axis (X-axis)**:
- Label: "Value"
- Range: 950 to 1100
- Increment: 50
## 2. Key Trends and Data Points
- **Peak Frequency**:
- Highest bar at **Value = 1000**
- Frequency: **25,000**
- **Distribution Shape**:
- Symmetric, bell-shaped curve with a **flat peak** centered at 1000.
- Frequency decreases symmetrically on both sides of the peak.
- **Notable Observations**:
- Bars taper gradually toward the edges (950 and 1100).
- No outliers or anomalies detected in the distribution.
## 3. Chart Components
- **Bars**:
- Color: Black
- Uniform width across all bins.
- **Axes**:
- No gridlines or annotations beyond axis labels and increments.
- **Legend**:
- **Absent**: No legend present in the chart.
## 4. Spatial Grounding and Verification
- **Legend Placement**: Not applicable (no legend exists).
- **Trend Verification**:
- Visual confirmation: Bars increase to 1000, peak at 25,000, then decrease symmetrically.
- No discrepancies between visual trends and axis markers.
## 5. Additional Notes
- The chart represents a **frequency distribution** of values, likely from a dataset with a central tendency around 1000.
- The flat peak suggests a uniform distribution of values near the mode (1000).
- No textual annotations or embedded data tables present.
## 6. Language and Transcription
- **Primary Language**: English
- **Transcribed Text**:
- Axis labels: "Frequency," "Value"
- Title: "Distribution of Values"
- Numerical increments: 5,000 (Y-axis), 50 (X-axis)