\n
## Diagram: Visualizing Training and Testing Instances
### Overview
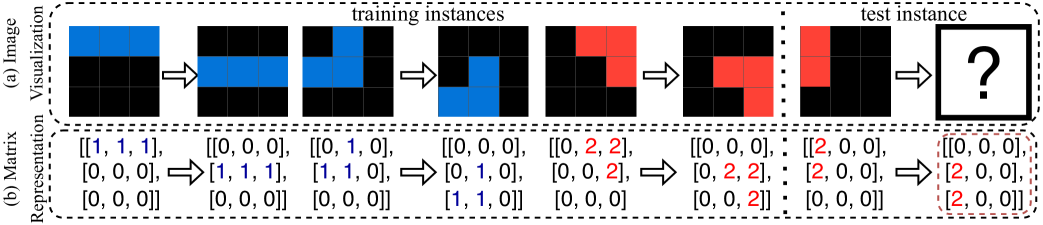
The image presents a diagram illustrating the concept of training and testing instances, likely within a machine learning context. It shows a sequence of "training instances" represented both visually as images and numerically as matrices, leading to a "test instance" with an unknown outcome. The diagram is split into two sections: (a) Image Visualization and (b) Matrix Representation.
### Components/Axes
* **Section (a) - Image Visualization:** Displays a series of 6 images arranged horizontally. Each image is a 3x3 grid of colored cells (blue, black, and red). Arrows indicate the flow from one image to the next. The images are labeled "training instances" except for the last one, which is labeled "test instance". The last image contains a question mark.
* **Section (b) - Matrix Representation:** Displays corresponding 3x3 matrices below each image. Each matrix contains numerical values (0, 1, and 2). Arrows connect each matrix to the next, mirroring the flow in the image visualization.
* **Labels:** "training instances" (repeated), "test instance", "(a) Image Visualization", "(b) Matrix Representation".
* **Color Coding:**
* Blue in the images corresponds to the value '1' in the matrices.
* Black in the images corresponds to the value '0' in the matrices.
* Red in the images corresponds to the value '2' in the matrices.
### Detailed Analysis or Content Details
The diagram shows a sequence of six instances. Let's analyze each step:
1. **Instance 1:**
* Image: Predominantly blue with some black cells.
* Matrix: `[[1, 1, 1], [0, 0, 0], [0, 0, 0]]`
2. **Instance 2:**
* Image: Blue and black cells.
* Matrix: `[[0, 0, 0], [1, 1, 1], [0, 0, 0]]`
3. **Instance 3:**
* Image: Blue and black cells.
* Matrix: `[[0, 1, 0], [1, 1, 0], [0, 0, 0]]`
4. **Instance 4:**
* Image: Blue, black, and red cells.
* Matrix: `[[0, 0, 2], [0, 2, 2], [1, 0, 0]]`
5. **Instance 5:**
* Image: Red and black cells.
* Matrix: `[[0, 0, 0], [2, 2, 0], [0, 0, 0]]`
6. **Instance 6 (Test Instance):**
* Image: Black and red cells with a question mark.
* Matrix: `[[0, 0, 0], [2, 0, 0], [0, 0, 0]]`
The arrows indicate a sequential progression, suggesting a time series or a process where each instance builds upon the previous one.
### Key Observations
* The color scheme consistently maps to the numerical values in the matrices.
* The transition from training instances to the test instance shows a shift in color distribution, with red becoming more prominent.
* The test instance is presented as an unknown, indicated by the question mark.
* The matrices represent a sparse representation of the images, with most values being 0.
### Interpretation
This diagram likely illustrates a learning process where a model is trained on the first five instances (training instances) and then tested on the sixth instance (test instance). The matrices could represent feature vectors or activations within a neural network. The changing color distribution suggests that the model is learning to recognize patterns or features associated with the red color. The question mark on the test instance indicates that the model needs to predict the outcome or classify the instance based on its training. The diagram demonstrates a simple example of supervised learning, where the model learns from labeled data (training instances) and then makes predictions on unseen data (test instance). The sparse matrix representation suggests that the features are not densely activated, and only a few features are relevant for each instance.