TECHNICAL ASSET FINGERPRINT
74a6a599710b03576d51f62c
Click to view fullscreen
Press ESC or click to close
FOUND IN PAPERS
EXPERT: healer-alpha-free VERSION 1
RUNTIME: free/openrouter/healer-alpha
INTEL_VERIFIED
## Diagram: Training and Test Instance Sequence for Pattern Recognition
### Overview
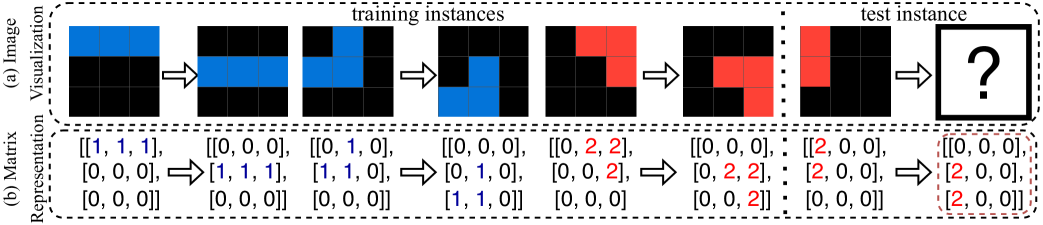
The image displays a technical diagram illustrating a sequence of six training instances followed by one test instance, presented in two parallel representations: (a) a visual grid-based "Image Visualization" and (b) a numerical "Matrix Representation." The diagram appears to depict a pattern recognition or machine learning task where a model learns from a sequence of examples to predict the final test instance.
### Components/Axes
The diagram is organized into two horizontal rows and multiple vertical columns, segmented by dashed lines.
**1. Row Labels (Left Side):**
* **(a) Image Visualization:** The top row, showing 3x3 grids with colored cells.
* **(b) Matrix Representation:** The bottom row, showing corresponding 3x3 matrices of numbers.
**2. Column Headers (Top):**
* **training instances:** Spans the first six columns (instances 1-6).
* **test instance:** Spans the final, seventh column.
**3. Visual Elements:**
* **Grids:** Each instance in row (a) is a 3x3 grid. Cells are either black (background/empty), blue, or red.
* **Matrices:** Each instance in row (b) is a 3x3 matrix enclosed in square brackets `[ ]`. Numbers are colored to match the corresponding grid cells (blue or red) or are black for zeros.
* **Arrows:** Right-pointing arrows (`→`) connect each instance to the next, indicating a sequence or transformation flow from left to right.
* **Question Mark:** The final grid in the "test instance" column contains a large black question mark `?` on a white background, indicating an unknown to be predicted.
* **Dashed Outline:** The final matrix in the "test instance" column is enclosed in a red dashed rectangle, highlighting it as the target for prediction.
### Detailed Analysis
The sequence progresses from left to right. Below is a precise transcription of each instance's matrix representation. The color of the numbers in the matrix corresponds to the color of the active cells in the visual grid above it.
**Training Instances (1-6):**
1. **Instance 1:**
* **Grid:** Top row is solid blue.
* **Matrix:** `[[1, 1, 1], [0, 0, 0], [0, 0, 0]]` (Top row numbers are blue).
2. **Instance 2:**
* **Grid:** Middle row is solid blue.
* **Matrix:** `[[0, 0, 0], [1, 1, 1], [0, 0, 0]]` (Middle row numbers are blue).
3. **Instance 3:**
* **Grid:** A blue "L" shape occupying the top-center, middle-center, and middle-left cells.
* **Matrix:** `[[0, 1, 0], [1, 1, 0], [0, 0, 0]]` (The `1`s forming the "L" are blue).
4. **Instance 4:**
* **Grid:** A blue "L" shape occupying the middle-center, middle-right, and bottom-right cells.
* **Matrix:** `[[0, 0, 0], [0, 1, 0], [1, 1, 0]]` (The `1`s forming the "L" are blue).
5. **Instance 5:**
* **Grid:** A red "L" shape occupying the top-center, top-right, and middle-right cells.
* **Matrix:** `[[0, 2, 2], [0, 0, 2], [0, 0, 0]]` (The `2`s forming the "L" are red).
6. **Instance 6:**
* **Grid:** A red "L" shape occupying the middle-center, middle-right, and bottom-right cells.
* **Matrix:** `[[0, 0, 0], [0, 2, 2], [0, 0, 2]]` (The `2`s forming the "L" are red).
**Test Instance (7):**
* **Grid:** Contains a single large question mark `?`.
* **Matrix (Target):** `[[2, 0, 0], [2, 0, 0], [2, 0, 0]]` (The `2`s in the first column are red, enclosed in a red dashed box).
### Key Observations
1. **Pattern Shift:** The first four training instances use the value `1` (blue). Instances 5 and 6 switch to the value `2` (red).
2. **Shape Progression:** The blue shapes (Instances 1-4) explore horizontal lines and "L" shapes in different orientations. The red shapes (Instances 5-6) also form "L" shapes but in different positions.
3. **Spatial Logic:** The sequence does not show a simple rotation or translation. It may represent a more abstract rule or a sequence of operations.
4. **Prediction Target:** The test instance's matrix (`[[2,0,0],[2,0,0],[2,0,0]]`) represents a vertical line of `2`s (red) in the first column. This is a new shape not seen in the training sequence, which featured horizontal lines and "L" shapes.
### Interpretation
This diagram is a classic representation of an **inductive reasoning or few-shot learning task**, likely from the field of artificial intelligence or cognitive science.
* **What it demonstrates:** The task requires an agent (human or AI) to infer an underlying rule or pattern from a limited sequence of examples (the six training instances) and then apply that rule to generate the correct output for a novel input (the test instance).
* **Relationship between elements:** The dual representation (visual grid and numerical matrix) is key. The grid provides an intuitive, spatial understanding of the pattern, while the matrix provides a formal, computational representation suitable for algorithmic processing. The arrows establish a temporal or logical sequence.
* **Underlying Rule (Hypothesis):** The data suggests a possible rule: **"After two blue 'L' shapes, the pattern switches to red and produces a vertical line."** However, this is speculative. The rule could be more complex, involving the position of the shapes, the count of instances, or a transformation applied at each step. The test instance's vertical line is a significant outlier compared to the training shapes, indicating the rule is not a simple repetition but involves generating a new, logically consistent form.
* **Peircean Investigation:** From a semiotic perspective:
* **Icons:** The grids are icons, directly resembling the patterns they represent.
* **Indices:** The arrows are indices, pointing to the sequential, causal relationship between instances.
* **Symbols:** The final question mark and the dashed matrix are symbols, representing the abstract problem of prediction and the unknown target, respectively. The entire diagram is a symbolic model of a learning process.
**Conclusion:** The image is not a chart of empirical data but a schematic of a logical puzzle. Its purpose is to visually and formally define a pattern completion problem, testing the ability to extract a generative rule from sequential examples. The "data" here is the sequence of shapes and numbers itself, and the "trend" is the progression of the pattern that must be deciphered to solve for the question mark.
DECODING INTELLIGENCE...