## Bar Chart: Process Time Comparison
### Overview
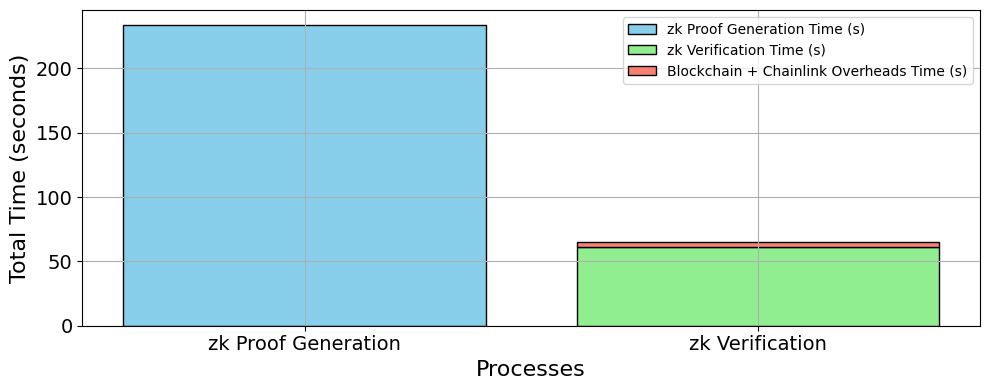
The image is a bar chart comparing the time taken for zk Proof Generation and zk Verification processes. The chart breaks down the total time for each process into its constituent parts: zk Proof Generation Time, zk Verification Time, and Blockchain + Chainlink Overheads Time.
### Components/Axes
* **X-axis:** "Processes" with two categories: "zk Proof Generation" and "zk Verification".
* **Y-axis:** "Total Time (seconds)" with a scale from 0 to 200 in increments of 50.
* **Legend (Top-Right):**
* Light Blue: "zk Proof Generation Time (s)"
* Light Green: "zk Verification Time (s)"
* Light Red: "Blockchain + Chainlink Overheads Time (s)"
### Detailed Analysis
* **zk Proof Generation:**
* The total time for zk Proof Generation is approximately 225 seconds.
* The entire time is attributed to "zk Proof Generation Time (s)" (light blue).
* **zk Verification:**
* The total time for zk Verification is approximately 62 seconds.
* "zk Verification Time (s)" (light green) accounts for approximately 58 seconds.
* "Blockchain + Chainlink Overheads Time (s)" (light red) accounts for approximately 4 seconds.
### Key Observations
* zk Proof Generation takes significantly longer than zk Verification.
* zk Proof Generation time dominates the overall time for the zk Proof Generation process.
* zk Verification time is the primary component of the zk Verification process, with a small overhead from Blockchain + Chainlink.
### Interpretation
The chart highlights the computational cost difference between generating a zk Proof and verifying it. The generation process is far more time-consuming than the verification process. The overhead associated with Blockchain and Chainlink is minimal compared to the core verification time. This suggests that optimizing the proof generation process would have the most significant impact on overall performance.