\n
## Bar Chart: Comparison of zk Proof Generation and Verification Time
### Overview
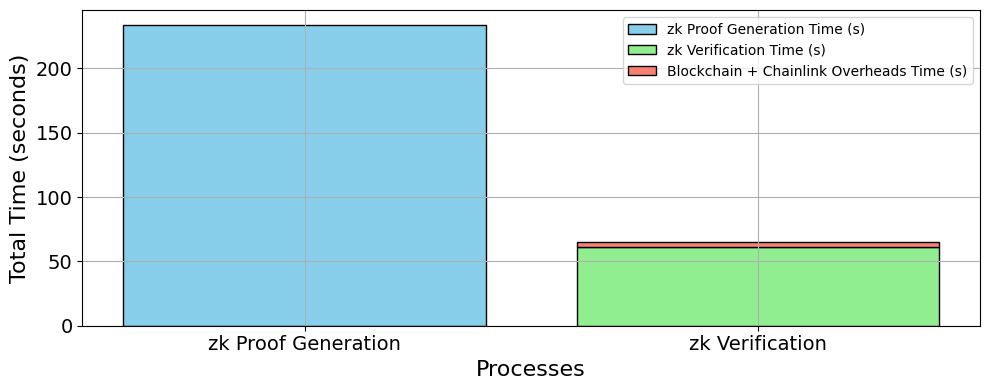
This bar chart compares the total time taken for zk Proof Generation versus zk Verification, including associated overheads. The chart uses stacked bars to show the breakdown of time for each process. The y-axis represents "Total Time (seconds)" and the x-axis represents "Processes" with two categories: "zk Proof Generation" and "zk Verification".
### Components/Axes
* **X-axis:** "Processes" with categories: "zk Proof Generation", "zk Verification".
* **Y-axis:** "Total Time (seconds)", ranging from 0 to 220 seconds, with increments of 50 seconds.
* **Legend:** Located in the top-right corner.
* "zk Proof Generation Time (s)" - Light Blue
* "zk Verification Time (s)" - Light Green
* "Blockchain + Chainlink Overheads Time (s)" - Red
* **Bars:** Stacked bars representing the total time for each process, broken down by the legend categories.
### Detailed Analysis
The chart presents two bars, one for "zk Proof Generation" and one for "zk Verification".
**zk Proof Generation:**
* The bar is entirely light blue, indicating that the total time is solely attributed to "zk Proof Generation Time (s)".
* The height of the bar is approximately 210 seconds (± 5 seconds).
**zk Verification:**
* This bar is stacked with three components.
* The bottom portion is light green, representing "zk Verification Time (s)". This portion is approximately 40 seconds (± 2 seconds).
* The top portion is red, representing "Blockchain + Chainlink Overheads Time (s)". This portion is approximately 10 seconds (± 1 second).
* The total height of the bar is approximately 50 seconds (± 3 seconds).
### Key Observations
* zk Proof Generation takes significantly longer than zk Verification. The generation time is roughly 4.2 times longer than the total verification time.
* The majority of the time for zk Verification is spent on the verification process itself, with a smaller portion attributed to blockchain and Chainlink overheads.
* The overhead time for zk Verification is relatively small compared to the verification time.
### Interpretation
The data suggests that zk Proof Generation is a computationally intensive process, requiring substantially more time than zk Verification. This is expected, as generating the proof requires complex calculations, while verification is a relatively simpler process. The small overhead associated with zk Verification indicates that the blockchain and Chainlink integration is efficient. This chart highlights the trade-offs between proof generation and verification in zero-knowledge systems. The significant difference in time could influence the design choices of applications utilizing zk-proofs, potentially favoring scenarios where proofs are generated less frequently and verified more often. The data could be used to optimize the proof generation process or to explore alternative verification methods to reduce overall latency.