\n
## Bar Chart: zk Proof Generation vs. zk Verification Time Breakdown
### Overview
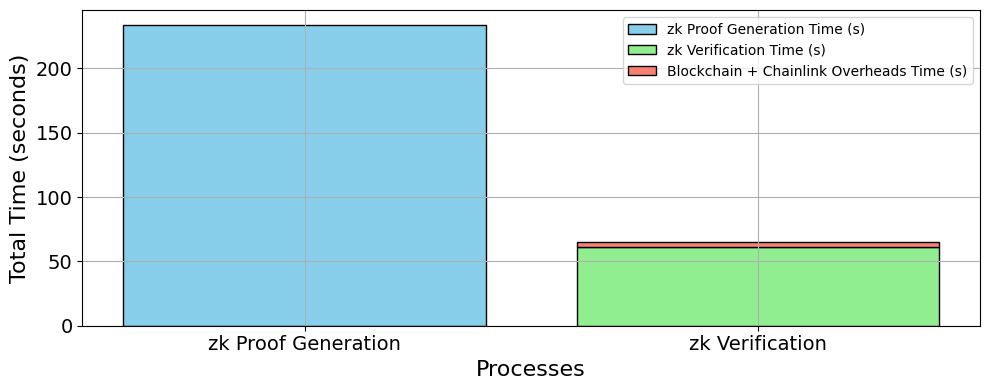
This is a stacked bar chart comparing the total time (in seconds) required for two distinct processes in a zero-knowledge (zk) system: "zk Proof Generation" and "zk Verification". The chart breaks down the total time for each process into its constituent components.
### Components/Axes
* **Chart Type:** Stacked Bar Chart.
* **X-Axis (Horizontal):** Labeled "Processes". It contains two categorical bars:
1. `zk Proof Generation` (left bar)
2. `zk Verification` (right bar)
* **Y-Axis (Vertical):** Labeled "Total Time (seconds)". The scale runs from 0 to approximately 240, with major gridlines at intervals of 50 seconds (0, 50, 100, 150, 200).
* **Legend:** Positioned in the top-right corner of the chart area. It defines three data series with corresponding colors:
* `zk Proof Generation Time (s)`: Light blue color.
* `zk Verification Time (s)`: Light green color.
* `Blockchain + Chainlink Overheads Time (s)`: Light red/salmon color.
### Detailed Analysis
**1. zk Proof Generation Process (Left Bar):**
* **Visual Trend:** This is a single, solid bar with no stacking.
* **Composition:** The entire bar is filled with the light blue color corresponding to "zk Proof Generation Time (s)". There are no green or red segments.
* **Data Point:** The top of the blue bar aligns with a value on the Y-axis of approximately **235 seconds**. This represents the total time for proof generation, which is entirely consumed by the proof generation computation itself.
**2. zk Verification Process (Right Bar):**
* **Visual Trend:** This is a stacked bar composed of two distinct color segments.
* **Composition & Data Points:**
* **Bottom Segment (Green):** This segment represents "zk Verification Time (s)". It starts at 0 and extends upward to approximately **60 seconds**.
* **Top Segment (Red):** This segment represents "Blockchain + Chainlink Overheads Time (s)". It is stacked on top of the green segment. It starts at ~60 seconds and ends at approximately **65 seconds**. Therefore, the overhead time is approximately **5 seconds** (65s - 60s).
* **Total Time:** The combined height of the green and red segments indicates a total time for the "zk Verification" process of approximately **65 seconds**.
### Key Observations
1. **Dominant Time Cost:** The "zk Proof Generation" process (235s) is significantly more time-consuming than the entire "zk Verification" process (65s), by a factor of roughly 3.6x.
2. **Verification Breakdown:** Within the verification process, the core "zk Verification Time" (60s) constitutes the vast majority (~92%) of the total time. The associated "Blockchain + Chainlink Overheads" are relatively minor (~5s, or ~8%).
3. **Process Isolation:** The chart clearly separates the two main phases of a zk workflow. Proof generation is a monolithic, computationally heavy task. Verification is faster and includes both the cryptographic verification and external system overheads.
### Interpretation
This chart provides a clear performance profile for a zero-knowledge proof system, likely in a blockchain or oracle context (given the "Chainlink" reference).
* **What the data suggests:** The primary bottleneck in this system is **proof generation**. Any optimization efforts should focus here, as even a 10% improvement would save over 23 seconds. The verification step, while non-trivial, is much faster. The overhead from integrating with a blockchain and Chainlink is minimal in comparison.
* **How elements relate:** The two bars represent the sequential or parallel stages of a zk-based application. A proof must be generated (expensive) before it can be verified (cheaper). The verification bar's stack shows that the act of verifying the proof on-chain (green) is the main component, with additional latency from blockchain consensus and oracle network communication (red).
* **Notable Anomalies/Considerations:** The chart does not specify the complexity of the proof being generated or verified. The absolute times (235s, 65s) are highly dependent on the specific circuit, hardware, and network conditions. The key takeaway is the **relative proportion** of time spent. The near-negligible overhead suggests an efficient integration design, where the cryptographic operations dominate the latency, not the external system calls.