## Bar Chart: zk Proof Generation vs Verification Time
### Overview
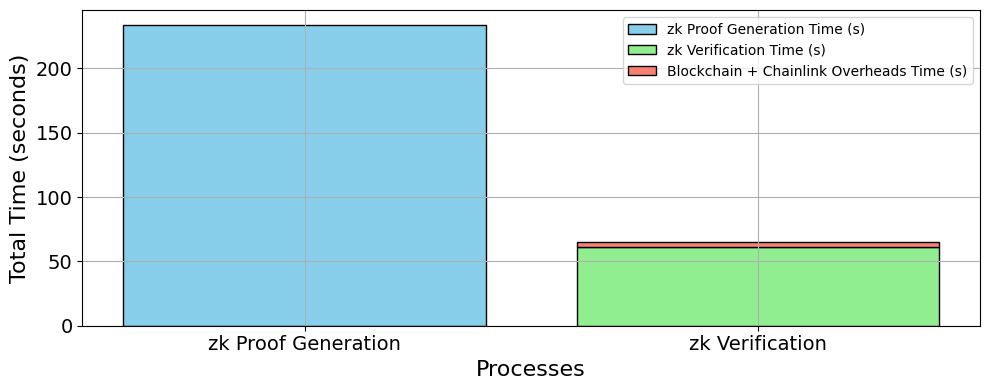
The chart compares two processes: "zk Proof Generation" and "zk Verification", measured by total time in seconds. A third component, "Blockchain + Chainlink Overheads Time", is visually represented as a small red segment within the "zk Verification" bar.
### Components/Axes
- **X-axis**: Labeled "Processes", with two categories:
- "zk Proof Generation" (left)
- "zk Verification" (right)
- **Y-axis**: Labeled "Total Time (seconds)", scaled from 0 to 250 in increments of 50.
- **Legend**: Positioned in the top-right corner, with three entries:
- **Blue**: "zk Proof Generation Time (s)"
- **Green**: "zk Verification Time (s)"
- **Red**: "Blockchain + Chainlink Overheads Time (s)"
### Detailed Analysis
- **zk Proof Generation**:
- Blue bar dominates the chart, reaching approximately **230 seconds**.
- No sub-components or color variations within the bar.
- **zk Verification**:
- Green bar spans ~60 seconds.
- A thin red segment (~5-10 seconds) overlays the top of the green bar, representing overhead time.
- **Legend Alignment**:
- Blue matches the "zk Proof Generation" bar.
- Green matches the "zk Verification" bar.
- Red matches the overhead segment within the green bar.
### Key Observations
1. **Dominance of Proof Generation**: The blue bar is ~3.8x taller than the green bar, indicating proof generation consumes significantly more time.
2. **Minimal Overhead**: The red segment is a small fraction (~8-17%) of the green bar, suggesting blockchain/chainlink overheads are negligible compared to verification time.
3. **Verification Efficiency**: The green bar’s compact size implies verification is relatively fast, but still dwarfed by proof generation.
### Interpretation
The data highlights a stark imbalance in computational effort:
- **Proof Generation** is the primary bottleneck, requiring ~230 seconds per operation.
- **Verification** is efficient but still time-consuming at ~60 seconds, with overheads contributing minimally (~5-10 seconds).
- The red segment’s placement atop the green bar visually emphasizes that overheads are additive but insignificant relative to verification time.
This suggests optimization opportunities for proof generation, while verification remains a secondary concern. The chart underscores the asymmetry in zk-SNARK/STARK workflows, where proof creation is resource-intensive compared to validation.