TECHNICAL ASSET FINGERPRINT
74ab283729b353c5805f0968
Click to view fullscreen
Press ESC or click to close
FOUND IN PAPERS
EXPERT: gemini-2.0-flash VERSION 1
RUNTIME: nugit/gemini/gemini-2.0-flash
INTEL_VERIFIED
## Chart Type: Line Graphs Comparing "I-Don't-Know" Rate
### Overview
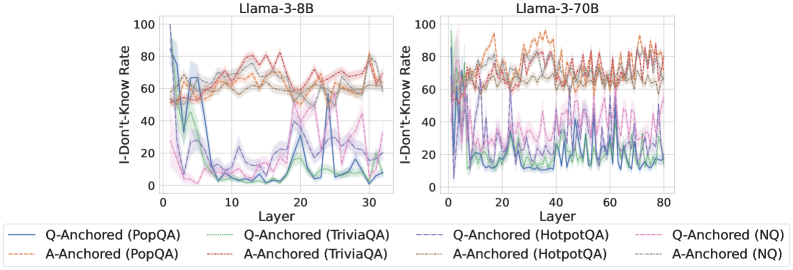
The image presents two line graphs side-by-side, comparing the "I-Don't-Know" rate across different layers of two language models: Llama-3-8B (left) and Llama-3-70B (right). Each graph plots the "I-Don't-Know" rate (y-axis) against the layer number (x-axis) for various question-answering datasets (PopQA, TriviaQA, HotpotQA, and NQ), with both question-anchored (Q-Anchored) and answer-anchored (A-Anchored) approaches. The shaded regions around each line represent the uncertainty or variance in the data.
### Components/Axes
* **Titles:**
* Left Graph: "Llama-3-8B"
* Right Graph: "Llama-3-70B"
* **Y-Axis:**
* Label: "I-Don't-Know Rate"
* Scale: 0 to 100, with tick marks at 0, 20, 40, 60, 80, and 100.
* **X-Axis:**
* Label: "Layer"
* Left Graph Scale: 0 to 30, with tick marks every 10 units.
* Right Graph Scale: 0 to 80, with tick marks every 20 units.
* **Legend:** Located at the bottom of the image, describing the lines:
* Blue solid line: "Q-Anchored (PopQA)"
* Brown dashed line: "A-Anchored (PopQA)"
* Green dotted line: "Q-Anchored (TriviaQA)"
* Brown dotted line: "A-Anchored (TriviaQA)"
* Red dashed line: "Q-Anchored (HotpotQA)"
* Brown dotted line: "A-Anchored (HotpotQA)"
* Purple dotted line: "Q-Anchored (NQ)"
* Brown dotted line: "A-Anchored (NQ)"
### Detailed Analysis
#### Llama-3-8B (Left Graph)
* **Q-Anchored (PopQA) (Blue solid line):** Starts at approximately 85-90% at layer 0, drops sharply to around 5-10% by layer 10, and then fluctuates between 5% and 30% for the remaining layers.
* **A-Anchored (PopQA) (Brown dashed line):** Starts at approximately 50% at layer 0, rises to around 60-70% and remains relatively stable with minor fluctuations.
* **Q-Anchored (TriviaQA) (Green dotted line):** Starts at approximately 60% at layer 0, drops to around 5-10% by layer 10, and then fluctuates between 5% and 20% for the remaining layers.
* **A-Anchored (TriviaQA) (Brown dotted line):** Starts at approximately 50% at layer 0, rises to around 60-70% and remains relatively stable with minor fluctuations.
* **Q-Anchored (HotpotQA) (Red dashed line):** Starts at approximately 60% at layer 0, rises to around 70-80% and remains relatively stable with minor fluctuations.
* **A-Anchored (HotpotQA) (Brown dotted line):** Starts at approximately 50% at layer 0, rises to around 60-70% and remains relatively stable with minor fluctuations.
* **Q-Anchored (NQ) (Purple dotted line):** Starts at approximately 60% at layer 0, drops to around 5-10% by layer 10, and then fluctuates between 5% and 20% for the remaining layers.
* **A-Anchored (NQ) (Brown dotted line):** Starts at approximately 50% at layer 0, rises to around 60-70% and remains relatively stable with minor fluctuations.
#### Llama-3-70B (Right Graph)
* **Q-Anchored (PopQA) (Blue solid line):** Starts at approximately 20% at layer 0, fluctuates between 10% and 40% for the remaining layers.
* **A-Anchored (PopQA) (Brown dashed line):** Starts at approximately 70% at layer 0, fluctuates between 60% and 90% for the remaining layers.
* **Q-Anchored (TriviaQA) (Green dotted line):** Starts at approximately 20% at layer 0, fluctuates between 10% and 30% for the remaining layers.
* **A-Anchored (TriviaQA) (Brown dotted line):** Starts at approximately 70% at layer 0, fluctuates between 60% and 80% for the remaining layers.
* **Q-Anchored (HotpotQA) (Red dashed line):** Starts at approximately 70% at layer 0, fluctuates between 60% and 90% for the remaining layers.
* **A-Anchored (HotpotQA) (Brown dotted line):** Starts at approximately 70% at layer 0, fluctuates between 60% and 80% for the remaining layers.
* **Q-Anchored (NQ) (Purple dotted line):** Starts at approximately 40% at layer 0, fluctuates between 20% and 50% for the remaining layers.
* **A-Anchored (NQ) (Brown dotted line):** Starts at approximately 70% at layer 0, fluctuates between 60% and 80% for the remaining layers.
### Key Observations
* For Llama-3-8B, the Q-Anchored approach for PopQA, TriviaQA, and NQ datasets shows a significant drop in the "I-Don't-Know" rate in the initial layers, while the A-Anchored approach remains relatively stable.
* For Llama-3-70B, the "I-Don't-Know" rates fluctuate more across layers for all datasets and anchoring methods compared to Llama-3-8B.
* The "I-Don't-Know" rate is generally higher for A-Anchored methods compared to Q-Anchored methods, especially for PopQA, TriviaQA, and NQ datasets in Llama-3-8B.
* HotpotQA consistently shows a higher "I-Don't-Know" rate compared to other datasets for both models and anchoring methods.
### Interpretation
The graphs illustrate how the "I-Don't-Know" rate varies across different layers of the Llama-3-8B and Llama-3-70B language models when answering questions from various datasets using question-anchored (Q-Anchored) and answer-anchored (A-Anchored) approaches.
The sharp drop in the "I-Don't-Know" rate for Q-Anchored methods in Llama-3-8B suggests that the model quickly learns to answer questions from PopQA, TriviaQA, and NQ datasets using the question as a starting point. The relatively stable "I-Don't-Know" rate for A-Anchored methods indicates that the model may find it more challenging to answer questions when starting from the answer.
The higher "I-Don't-Know" rates and greater fluctuations in Llama-3-70B suggest that this larger model may be more sensitive to the specific layer and anchoring method used. The consistently high "I-Don't-Know" rate for HotpotQA indicates that this dataset may contain more complex or ambiguous questions that the models struggle to answer.
The differences in "I-Don't-Know" rates between the two models and across datasets and anchoring methods highlight the importance of carefully selecting the appropriate model, dataset, and anchoring method for a given question-answering task. The data suggests that smaller models may be more efficient for certain tasks, while larger models may be necessary for more complex questions.
DECODING INTELLIGENCE...
EXPERT: nemotron-free VERSION 2
RUNTIME: free/nvidia/nemotron-nano-12b-v2-vl:free
INTEL_VERIFIED
## Line Graph: I-Don't-Know Rate Across Layers for Llama-3-8B and Llama-3-70B Models
### Overview
The image contains two line graphs comparing the "I-Don't-Know Rate" (IDK Rate) across transformer model layers for two Llama-3 variants: 8B (3.8B parameters) and 70B (70B parameters). The graphs visualize performance across four datasets: PopQA, TriviaQA, HotpotQA, and NQ, differentiated by Q-Anchored (question-focused) and A-Anchored (answer-focused) configurations. Data is presented with shaded confidence intervals.
### Components/Axes
- **X-Axis (Layer)**:
- Llama-3-8B: 0–30 layers
- Llama-3-70B: 0–80 layers
- **Y-Axis (I-Don't-Know Rate)**: 0–100% scale
- **Legend**:
- Position: Bottom center
- Entries:
- **Q-Anchored (PopQA)**: Solid blue
- **A-Anchored (PopQA)**: Dashed orange
- **Q-Anchored (TriviaQA)**: Dotted green
- **A-Anchored (TriviaQA)**: Dash-dot purple
- **Q-Anchored (HotpotQA)**: Solid red
- **A-Anchored (HotpotQA)**: Dotted pink
- **Q-Anchored (NQ)**: Dashed gray
- **A-Anchored (NQ)**: Dotted cyan
### Detailed Analysis
#### Llama-3-8B (Left Graph)
- **Q-Anchored (PopQA)**:
- Starts at ~95% IDK in layer 0, drops sharply to ~10% by layer 10, then fluctuates between 10–30%.
- **A-Anchored (PopQA)**:
- Starts at ~60%, dips to ~20% by layer 15, then stabilizes near 30–40%.
- **Q-Anchored (TriviaQA)**:
- Peaks at ~80% in layer 5, drops to ~10% by layer 20, then oscillates between 10–40%.
- **A-Anchored (TriviaQA)**:
- Starts at ~50%, rises to ~70% by layer 10, then declines to ~30% by layer 30.
- **Q-Anchored (HotpotQA)**:
- Begins at ~70%, spikes to ~90% in layer 5, then stabilizes at 40–60%.
- **A-Anchored (HotpotQA)**:
- Starts at ~50%, rises to ~80% by layer 10, then declines to ~40%.
- **Q-Anchored (NQ)**:
- Starts at ~85%, drops to ~20% by layer 10, then fluctuates between 10–30%.
- **A-Anchored (NQ)**:
- Starts at ~60%, rises to ~80% by layer 15, then declines to ~40%.
#### Llama-3-70B (Right Graph)
- **Q-Anchored (PopQA)**:
- Starts at ~90%, drops to ~15% by layer 20, then fluctuates between 10–30%.
- **A-Anchored (PopQA)**:
- Starts at ~55%, rises to ~70% by layer 40, then declines to ~50%.
- **Q-Anchored (TriviaQA)**:
- Peaks at ~85% in layer 10, drops to ~20% by layer 40, then oscillates between 10–40%.
- **A-Anchored (TriviaQA)**:
- Starts at ~45%, rises to ~75% by layer 30, then declines to ~50%.
- **Q-Anchored (HotpotQA)**:
- Begins at ~65%, spikes to ~95% in layer 20, then stabilizes at 50–70%.
- **A-Anchored (HotpotQA)**:
- Starts at ~50%, rises to ~85% by layer 50, then declines to ~60%.
- **Q-Anchored (NQ)**:
- Starts at ~80%, drops to ~10% by layer 30, then fluctuates between 5–25%.
- **A-Anchored (NQ)**:
- Starts at ~55%, rises to ~80% by layer 60, then declines to ~50%.
### Key Observations
1. **Model Size Impact**: Llama-3-70B shows more pronounced fluctuations in IDK rates compared to Llama-3-8B, suggesting larger models may struggle more with certain datasets in specific layers.
2. **Dataset Variability**:
- **HotpotQA** consistently shows the highest IDK rates, especially in Q-Anchored configurations.
- **NQ** exhibits the most dramatic drops in IDK rates for Q-Anchored models.
3. **Anchoring Effects**:
- Q-Anchored models generally show steeper initial drops in IDK rates but higher volatility in later layers.
- A-Anchored models maintain higher IDK rates in mid-layers (e.g., layers 20–50 for Llama-3-70B).
4. **Confidence Intervals**: Shaded regions indicate uncertainty, with wider bands in Llama-3-70B, particularly for TriviaQA and HotpotQA.
### Interpretation
The data suggests that:
- **Q-Anchored models** (question-focused) may prioritize early-layer processing for certain datasets (e.g., PopQA, NQ), while **A-Anchored models** (answer-focused) show delayed but sustained IDK rates in mid-layers.
- The **HotpotQA dataset** poses the greatest challenge, with IDK rates exceeding 80% in multiple layers for both model sizes.
- Llama-3-70B’s increased layer count (80 vs. 30) correlates with more complex IDK patterns, potentially reflecting deeper contextual analysis but also greater uncertainty in specific layers.
- The **NQ dataset** demonstrates the most effective Q-Anchored performance, with IDK rates dropping below 20% in later layers for Llama-3-8B.
This analysis highlights trade-offs between model scale, anchoring strategies, and dataset-specific challenges in knowledge retrieval tasks.
DECODING INTELLIGENCE...