## Line Chart: I-Don't-Know Rate vs. Layer for Llama-3 Models
### Overview
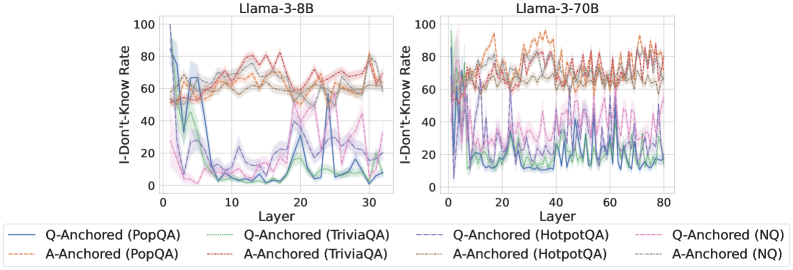
The image displays two side-by-side line charts comparing the "I-Don't-Know Rate" across the layers of two different-sized language models: Llama-3-8B (left) and Llama-3-70B (right). The charts analyze model uncertainty on four question-answering (QA) datasets under two different prompting conditions ("Q-Anchored" and "A-Anchored").
### Components/Axes
* **Chart Titles:** "Llama-3-8B" (left chart), "Llama-3-70B" (right chart).
* **Y-Axis (Both Charts):** Label: "I-Don't-Know Rate". Scale: 0 to 100, with major tick marks at 0, 20, 40, 60, 80, 100.
* **X-Axis (Left Chart - Llama-3-8B):** Label: "Layer". Scale: 0 to 30, with major tick marks at 0, 10, 20, 30.
* **X-Axis (Right Chart - Llama-3-70B):** Label: "Layer". Scale: 0 to 80, with major tick marks at 0, 20, 40, 60, 80.
* **Legend (Bottom, spanning both charts):** Contains 8 entries, differentiating lines by color and style (solid vs. dashed).
| Style | Color | Dataset | Condition |
| :--- | :--- | :--- | :--- |
| Solid | Blue | PopQA | Q-Anchored |
| Solid | Green | TriviaQA | Q-Anchored |
| Solid | Purple | HotpotQA | Q-Anchored |
| Solid | Pink | NQ | Q-Anchored |
| Dashed | Orange | PopQA | A-Anchored |
| Dashed | Red | TriviaQA | A-Anchored |
| Dashed | Brown | HotpotQA | A-Anchored |
| Dashed | Gray | NQ | A-Anchored |
### Detailed Analysis
**Chart 1: Llama-3-8B (Left)**
* **Q-Anchored Lines (Solid):** All four solid lines exhibit a similar, dramatic trend. They start at a very high I-Don't-Know Rate (approximately 80-95) at Layer 0. There is a sharp, precipitous drop within the first 5 layers, falling to rates between ~5 and ~30. After this initial drop, the lines fluctuate significantly across the remaining layers (5-30), with no clear upward or downward trend, oscillating mostly between 5 and 40. The blue (PopQA) and green (TriviaQA) lines generally remain at the lower end of this range.
* **A-Anchored Lines (Dashed):** In stark contrast, the four dashed lines show a much more stable and elevated pattern. They begin at a moderate rate (approximately 50-65) at Layer 0. They show a slight, gradual increase over the first ~15 layers, peaking around 70-80. From layer 15 to 30, they fluctuate but remain consistently high, mostly between 60 and 80. The orange (PopQA) and red (TriviaQA) dashed lines are often the highest.
**Chart 2: Llama-3-70B (Right)**
* **Q-Anchored Lines (Solid):** The pattern is more volatile than in the 8B model. The lines start high (70-100) at Layer 0 and drop sharply within the first 10 layers, similar to the 8B model. However, the subsequent fluctuations are more extreme and frequent across the entire 80-layer span. The rates frequently spike and dip between ~5 and ~50. The purple (HotpotQA) line shows particularly high volatility.
* **A-Anchored Lines (Dashed):** These lines also start high (60-90) and remain elevated throughout. They exhibit significant volatility, with frequent peaks and troughs across all layers, generally staying within the 50-90 range. The orange (PopQA) and red (TriviaQA) dashed lines again frequently register the highest rates, often peaking above 80.
### Key Observations
1. **Anchoring Effect:** The most prominent pattern is the stark difference between Q-Anchored (solid) and A-Anchored (dashed) conditions. A-Anchored prompting consistently results in a much higher "I-Don't-Know Rate" across all layers for both model sizes.
2. **Early Layer Drop:** Both models show a dramatic decrease in uncertainty (I-Don't-Know Rate) for Q-Anchored prompts within the first 5-10 layers.
3. **Model Size & Volatility:** The larger Llama-3-70B model exhibits greater volatility in its uncertainty rates across deeper layers compared to the 8B model, for both prompting conditions.
4. **Dataset Variation:** PopQA (blue/orange) and TriviaQA (green/red) often represent the extremes within their respective line groups (Q-Anchored or A-Anchored).
### Interpretation
This data suggests that the method of prompting ("anchoring") has a profound and consistent impact on a model's expressed uncertainty, more so than the specific layer or even the model size. "A-Anchored" prompts (likely providing an answer anchor) lead the model to express high uncertainty ("I-Don't-Know") throughout its processing layers. Conversely, "Q-Anchored" prompts (likely providing only a question anchor) cause the model to rapidly reduce its expressed uncertainty in the early layers, after which uncertainty fluctuates at a lower level.
The increased volatility in the larger 70B model might indicate more complex internal processing or specialization across its many layers. The early-layer drop in the Q-Anchored condition could represent a phase where the model quickly commits to a knowledge retrieval pathway, reducing its initial "I don't know" stance. The persistent high rate in the A-Anchored condition is counter-intuitive and warrants investigation—it may reflect a failure mode where providing an answer context somehow triggers a more conservative, "I don't know" response strategy. The chart effectively visualizes how model behavior and self-assessed confidence are not static but evolve dynamically through the network's depth and are highly sensitive to input framing.