## Line Graph: I-Don't-Know Rate Across Layers for Llama-3-8B and Llama-3-70B Models
### Overview
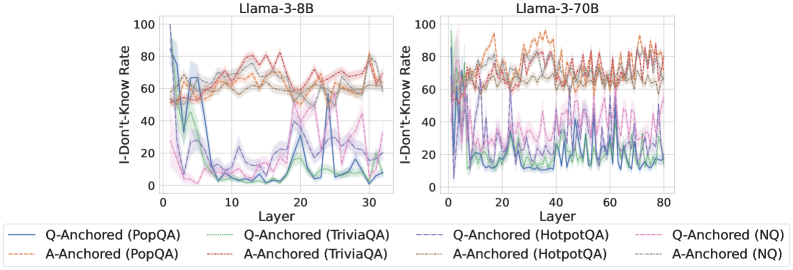
The image contains two line graphs comparing the "I-Don't-Know Rate" (IDK Rate) across transformer model layers for two Llama-3 variants: 8B (3.8B parameters) and 70B (70B parameters). The graphs visualize performance across four datasets: PopQA, TriviaQA, HotpotQA, and NQ, differentiated by Q-Anchored (question-focused) and A-Anchored (answer-focused) configurations. Data is presented with shaded confidence intervals.
### Components/Axes
- **X-Axis (Layer)**:
- Llama-3-8B: 0–30 layers
- Llama-3-70B: 0–80 layers
- **Y-Axis (I-Don't-Know Rate)**: 0–100% scale
- **Legend**:
- Position: Bottom center
- Entries:
- **Q-Anchored (PopQA)**: Solid blue
- **A-Anchored (PopQA)**: Dashed orange
- **Q-Anchored (TriviaQA)**: Dotted green
- **A-Anchored (TriviaQA)**: Dash-dot purple
- **Q-Anchored (HotpotQA)**: Solid red
- **A-Anchored (HotpotQA)**: Dotted pink
- **Q-Anchored (NQ)**: Dashed gray
- **A-Anchored (NQ)**: Dotted cyan
### Detailed Analysis
#### Llama-3-8B (Left Graph)
- **Q-Anchored (PopQA)**:
- Starts at ~95% IDK in layer 0, drops sharply to ~10% by layer 10, then fluctuates between 10–30%.
- **A-Anchored (PopQA)**:
- Starts at ~60%, dips to ~20% by layer 15, then stabilizes near 30–40%.
- **Q-Anchored (TriviaQA)**:
- Peaks at ~80% in layer 5, drops to ~10% by layer 20, then oscillates between 10–40%.
- **A-Anchored (TriviaQA)**:
- Starts at ~50%, rises to ~70% by layer 10, then declines to ~30% by layer 30.
- **Q-Anchored (HotpotQA)**:
- Begins at ~70%, spikes to ~90% in layer 5, then stabilizes at 40–60%.
- **A-Anchored (HotpotQA)**:
- Starts at ~50%, rises to ~80% by layer 10, then declines to ~40%.
- **Q-Anchored (NQ)**:
- Starts at ~85%, drops to ~20% by layer 10, then fluctuates between 10–30%.
- **A-Anchored (NQ)**:
- Starts at ~60%, rises to ~80% by layer 15, then declines to ~40%.
#### Llama-3-70B (Right Graph)
- **Q-Anchored (PopQA)**:
- Starts at ~90%, drops to ~15% by layer 20, then fluctuates between 10–30%.
- **A-Anchored (PopQA)**:
- Starts at ~55%, rises to ~70% by layer 40, then declines to ~50%.
- **Q-Anchored (TriviaQA)**:
- Peaks at ~85% in layer 10, drops to ~20% by layer 40, then oscillates between 10–40%.
- **A-Anchored (TriviaQA)**:
- Starts at ~45%, rises to ~75% by layer 30, then declines to ~50%.
- **Q-Anchored (HotpotQA)**:
- Begins at ~65%, spikes to ~95% in layer 20, then stabilizes at 50–70%.
- **A-Anchored (HotpotQA)**:
- Starts at ~50%, rises to ~85% by layer 50, then declines to ~60%.
- **Q-Anchored (NQ)**:
- Starts at ~80%, drops to ~10% by layer 30, then fluctuates between 5–25%.
- **A-Anchored (NQ)**:
- Starts at ~55%, rises to ~80% by layer 60, then declines to ~50%.
### Key Observations
1. **Model Size Impact**: Llama-3-70B shows more pronounced fluctuations in IDK rates compared to Llama-3-8B, suggesting larger models may struggle more with certain datasets in specific layers.
2. **Dataset Variability**:
- **HotpotQA** consistently shows the highest IDK rates, especially in Q-Anchored configurations.
- **NQ** exhibits the most dramatic drops in IDK rates for Q-Anchored models.
3. **Anchoring Effects**:
- Q-Anchored models generally show steeper initial drops in IDK rates but higher volatility in later layers.
- A-Anchored models maintain higher IDK rates in mid-layers (e.g., layers 20–50 for Llama-3-70B).
4. **Confidence Intervals**: Shaded regions indicate uncertainty, with wider bands in Llama-3-70B, particularly for TriviaQA and HotpotQA.
### Interpretation
The data suggests that:
- **Q-Anchored models** (question-focused) may prioritize early-layer processing for certain datasets (e.g., PopQA, NQ), while **A-Anchored models** (answer-focused) show delayed but sustained IDK rates in mid-layers.
- The **HotpotQA dataset** poses the greatest challenge, with IDK rates exceeding 80% in multiple layers for both model sizes.
- Llama-3-70B’s increased layer count (80 vs. 30) correlates with more complex IDK patterns, potentially reflecting deeper contextual analysis but also greater uncertainty in specific layers.
- The **NQ dataset** demonstrates the most effective Q-Anchored performance, with IDK rates dropping below 20% in later layers for Llama-3-8B.
This analysis highlights trade-offs between model scale, anchoring strategies, and dataset-specific challenges in knowledge retrieval tasks.