## Flowchart Diagram: Step-by-Step Reasoning Process to Final Output
### Overview
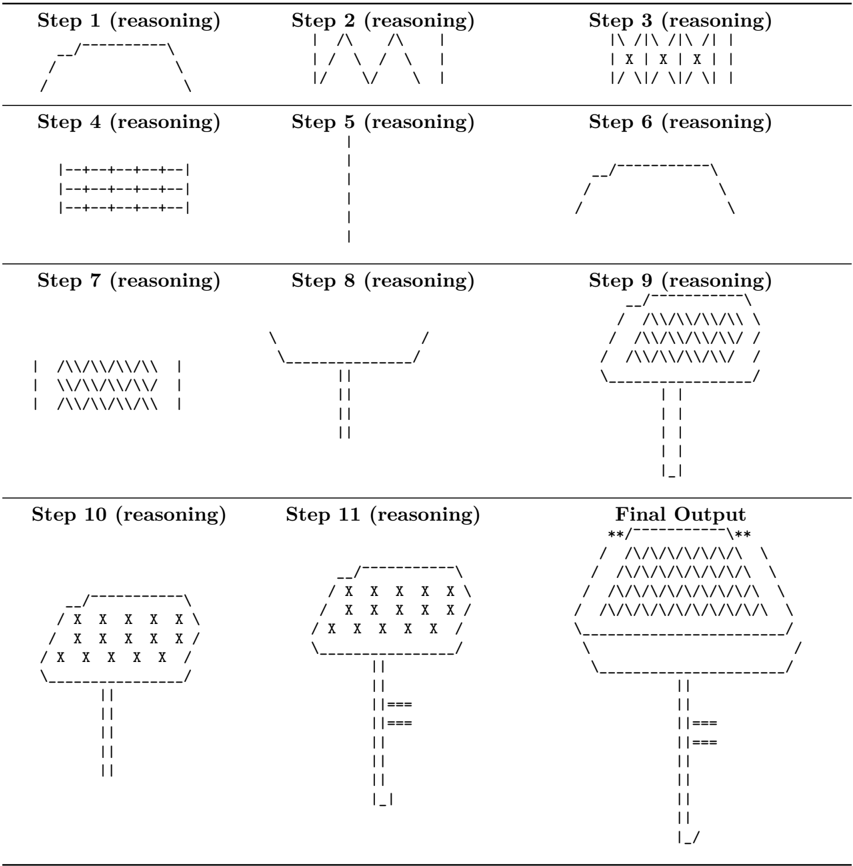
The image depicts a sequential reasoning process visualized through 11 distinct steps (Step 1–Step 11), each represented by abstract geometric patterns of lines, slashes, and symbols. These steps culminate in a complex "Final Output" structure that integrates elements from prior stages. The diagram uses dashed lines, solid lines, and symbolic characters (X, /, |, =) to represent logical operations or transformations.
---
### Components/Axes
- **Steps 1–11**: Each step is labeled with "Step X (reasoning)" (X = 1–11) and contains unique geometric patterns:
- **Step 1**: Dashed line with a peak (resembling a mountain).
- **Step 2**: Vertical dashed lines with zigzag patterns.
- **Step 3**: Grid of X's and slashes.
- **Step 4**: Three horizontal dashed lines with increasing dashes.
- **Step 5**: Vertical dashed line with a single dash.
- **Step 6**: Dashed line with a peak (similar to Step 1 but inverted).
- **Step 7**: Grid of slashes forming a matrix.
- **Step 8**: Vertical dashed line with a horizontal dashed line.
- **Step 9**: Hexagonal pattern with slashes and a vertical dashed line.
- **Step 10**: Grid of X's and equals signs.
- **Step 11**: Hexagonal pattern with X's and equals signs.
- **Final Output**: A composite structure combining elements from Steps 9–11, featuring:
- A hexagonal top with slashes.
- A vertical column with equals signs.
- A base with a slash and underscore.
---
### Detailed Analysis
#### Step-by-Step Breakdown
1. **Step 1**: A single dashed line with a peak (resembling a mountain).
- Text: `Step 1 (reasoning)`.
2. **Step 2**: Three vertical dashed lines with zigzag patterns (resembling waves).
- Text: `Step 2 (reasoning)`.
3. **Step 3**: Grid of X's and slashes (X | X | X | X).
- Text: `Step 3 (reasoning)`.
4. **Step 4**: Three horizontal dashed lines with increasing dashes (3, 5, 7).
- Text: `Step 4 (reasoning)`.
5. **Step 5**: Single vertical dashed line with a single dash.
- Text: `Step 5 (reasoning)`.
6. **Step 6**: Dashed line with a peak (inverted compared to Step 1).
- Text: `Step 6 (reasoning)`.
7. **Step 7**: Grid of slashes forming a 3x3 matrix.
- Text: `Step 7 (reasoning)`.
8. **Step 8**: Vertical dashed line with a horizontal dashed line intersecting it.
- Text: `Step 8 (reasoning)`.
9. **Step 9**: Hexagonal pattern with slashes and a vertical dashed line.
- Text: `Step 9 (reasoning)`.
10. **Step 10**: Grid of X's and equals signs (X = X = X = X).
- Text: `Step 10 (reasoning)`.
11. **Step 11**: Hexagonal pattern with X's and equals signs.
- Text: `Step 11 (reasoning)`.
#### Final Output
- A composite structure integrating elements from Steps 9–11:
- **Top**: Hexagonal pattern with slashes (from Step 9).
- **Middle**: Vertical column with equals signs (from Step 10–11).
- **Base**: Horizontal line with a slash and underscore (`/ _`).
- Text: `**Final Output**`.
---
### Key Observations
1. **Symbolic Progression**: Each step introduces new symbols (e.g., X, /, =) that build complexity.
2. **Geometric Repetition**: Hexagonal and grid patterns recur in later steps, suggesting iterative refinement.
3. **Dashed Lines**: Used consistently to denote intermediate reasoning steps.
4. **Final Output Complexity**: Combines multiple symbols (slashes, equals, X's) into a unified structure.
---
### Interpretation
The diagram represents a logical or computational process where each step refines or transforms data through symbolic operations:
- **Steps 1–6**: Establish foundational patterns (peaks, grids, lines).
- **Steps 7–9**: Introduce matrices and hexagonal structures, possibly representing data encoding.
- **Steps 10–11**: Use X's and equals signs to denote equivalence or substitution rules.
- **Final Output**: Synthesizes these elements into a hierarchical structure, suggesting a conclusion or result derived from iterative reasoning.
The absence of numerical data implies the diagram abstracts a conceptual workflow (e.g., algorithm design, problem-solving framework) rather than quantitative analysis. The use of geometric patterns may symbolize stages of abstraction or transformation in a decision-making process.