# Technical Document Extraction: Token Frequency Density Histogram
## 1. Component Isolation
* **Header/Legend Region:** Located in the top-right quadrant. Contains a legend for a statistical threshold.
* **Main Chart Region:** Occupies the central and lower portion of the image. It is a histogram showing the distribution of "Tokens."
* **Axes Region:** Left vertical axis (Y) and bottom horizontal axis (X).
---
## 2. Metadata and Labels
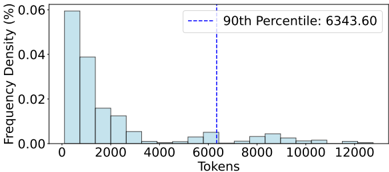
* **Y-Axis Title:** Frequency Density (%)
* **X-Axis Title:** Tokens
* **Legend Label:** 90th Percentile: 6343.60
* **Legend Visual:** A dashed blue vertical line.
* **Language:** English (100%)
---
## 3. Axis Scales and Markers
### Y-Axis (Frequency Density %)
* **Range:** 0.00 to 0.06
* **Major Tick Markers:** 0.00, 0.02, 0.04, 0.06
### X-Axis (Tokens)
* **Range:** 0 to approximately 13,000
* **Major Tick Markers:** 0, 2000, 4000, 6000, 8000, 10000, 12000
---
## 4. Data Analysis and Trends
### Distribution Overview
The chart displays a **right-skewed (positively skewed) distribution**. The vast majority of the data points are concentrated at the lower end of the "Tokens" scale, with a long tail extending toward the higher values.
### Histogram Bin Analysis (Estimated Values)
The histogram consists of light blue bars with dark outlines.
* **Primary Peak:** The highest frequency density occurs in the first bin (approx. 0 to 600 tokens), reaching a density of **0.06%**.
* **Initial Decay:** There is a sharp drop-off in frequency as token count increases.
* Bin 2 (~600-1200): ~0.039%
* Bin 3 (~1200-1800): ~0.016%
* Bin 4 (~1800-2400): ~0.013%
* **Secondary Clusters:** There are small "bumps" or local clusters in the tail:
* A small cluster around the **6000** token mark.
* A small cluster between **8000 and 10000** tokens.
* **The Tail:** The data continues sparsely up to approximately 12,500 tokens.
### Statistical Threshold (Spatial Grounding)
* **Feature:** Dashed Blue Line.
* **Placement:** Positioned vertically at the **6343.60** mark on the X-axis.
* **Significance:** This represents the **90th Percentile**. Visually, this confirms that 90% of the total area under the histogram bars lies to the left of this line (below 6343.60 tokens), while only 10% of the data exceeds this value.
---
## 5. Summary of Findings
This technical visualization indicates that the dataset is dominated by short sequences (under 2000 tokens). While the range extends significantly to over 12,000 tokens, these high-token instances are outliers or rare occurrences, as evidenced by the 90th percentile cutoff appearing relatively early in the overall horizontal span of the chart.