## Bar Chart: Frequency Density of Tokens
### Overview
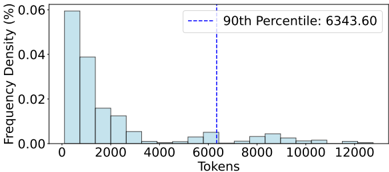
The image is a bar chart depicting the frequency density distribution of tokens. The x-axis represents token counts (0 to 12,000), and the y-axis represents frequency density in percentage (0% to 0.06%). A vertical dashed line marks the 90th percentile at 6,343.60 tokens.
### Components/Axes
- **X-axis (Tokens)**: Labeled "Tokens" with discrete intervals (0, 2,000, 4,000, 6,000, 8,000, 10,000, 12,000).
- **Y-axis (Frequency Density %)**: Labeled "Frequency Density (%)" with increments from 0.00 to 0.06.
- **Legend**: A box in the top-right corner contains the text "90th Percentile: 6343.60" with a dashed blue line extending downward to the x-axis.
### Detailed Analysis
- **Bars**:
- The tallest bar is at **0 tokens**, with a frequency density of ~0.06%.
- Subsequent bars decrease in height:
- ~0.04% at ~2,000 tokens.
- ~0.02% at ~4,000 tokens.
- Smaller bars at ~6,000, 8,000, and 10,000 tokens (~0.005% each).
- No bars are visible beyond 12,000 tokens.
- **90th Percentile**: The dashed blue line at **6,343.60 tokens** intersects the x-axis, indicating that 90% of tokens fall below this value.
### Key Observations
1. **Highest Frequency at 0 Tokens**: The distribution is heavily skewed, with the majority of tokens concentrated at the lowest value.
2. **Rapid Decline**: Frequency density drops sharply after 2,000 tokens, suggesting a long-tailed distribution.
3. **90th Percentile Marker**: The 90th percentile value (6,343.60) is significantly higher than the peak frequency, indicating a wide spread in token counts.
### Interpretation
The chart demonstrates a **long-tailed distribution** of tokens, where most tokens are small in value (e.g., 0–2,000 tokens), but a small fraction of tokens are much larger (up to 12,000). The 90th percentile at 6,343.60 tokens implies that 90% of all tokens fall below this threshold, highlighting the dominance of low-frequency tokens. This pattern is typical in datasets like text corpora, where short words or phrases (low tokens) are far more common than rare, long sequences. The absence of bars beyond 12,000 tokens suggests a natural cutoff or truncation in the data collection process.