## Heatmap: Layer vs. Token
### Overview
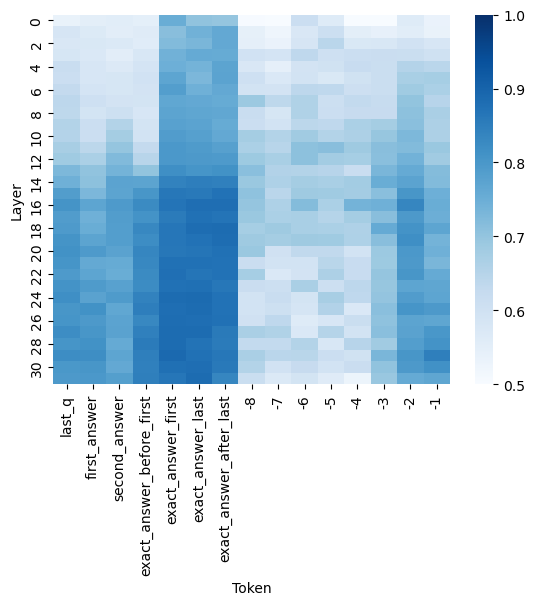
The image is a heatmap visualizing the relationship between "Layer" (y-axis) and "Token" (x-axis). The color intensity represents a value, ranging from 0.5 (lightest blue) to 1.0 (darkest blue), as indicated by the colorbar on the right. The heatmap shows how different tokens are represented across different layers.
### Components/Axes
* **X-axis (Token):** Categorical labels include: "last\_q", "first\_answer", "second\_answer", "exact\_answer\_before\_first", "exact\_answer\_first", "exact\_answer\_last", "exact\_answer\_after\_last", "-8", "-7", "-6", "-5", "-4", "-3", "-2", "-1".
* **Y-axis (Layer):** Numerical labels range from 0 to 30, in increments of 2 (0, 2, 4, 6, 8, 10, 12, 14, 16, 18, 20, 22, 24, 26, 28, 30).
* **Colorbar:** Ranges from 0.5 to 1.0, with increments of 0.1 (0.5, 0.6, 0.7, 0.8, 0.9, 1.0). Darker blue indicates higher values, while lighter blue indicates lower values.
### Detailed Analysis
The heatmap displays varying intensities of blue, indicating different values for each layer-token combination.
* **Tokens "last\_q", "first\_answer", "second\_answer", "exact\_answer\_before\_first", "exact\_answer\_first", "exact\_answer\_last", "exact\_answer\_after\_last":** These tokens generally show higher values (darker blue) in the lower layers (approximately layers 16 to 30). The "exact\_answer\_first" and "exact\_answer\_last" tokens appear to have the highest values in the lower layers.
* **Tokens "-8" to "-1":** These tokens generally show lower values (lighter blue) compared to the other tokens, especially in the lower layers. There appears to be a slight increase in values (darker blue) in the higher layers (approximately layers 0 to 10) for some of these tokens.
### Key Observations
* The tokens related to "exact\_answer" (before, first, last, after) show a strong signal in the lower layers.
* The numerical tokens ("-8" to "-1") have a weaker signal overall.
* There is a noticeable difference in the heatmap pattern between the named tokens and the numerical tokens.
### Interpretation
The heatmap likely represents the activation or importance of different tokens across different layers of a neural network model. The darker blue regions suggest that certain tokens are more relevant or have a stronger influence in specific layers. The "exact\_answer" related tokens being prominent in the lower layers might indicate that these tokens are crucial for initial processing or understanding of the input. The numerical tokens having lower values could mean they are less important for the task the model is performing, or that their importance is distributed across multiple layers. The heatmap provides insights into how the model processes different types of tokens at different stages of its computation.