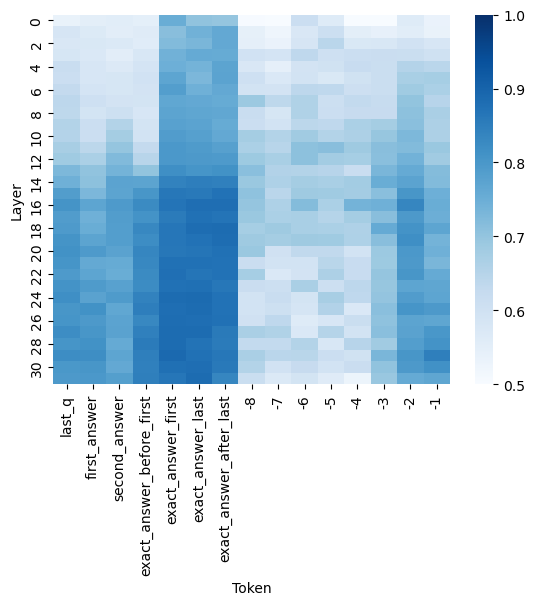
## Heatmap: Token-Layer Attention Distribution
### Overview
The image displays a heatmap visualizing the distribution of attention weights across different layers (y-axis) and tokens (x-axis) in a neural network model. The color intensity represents the magnitude of attention values, with darker blue indicating higher values (closer to 1.0) and lighter blue indicating lower values (closer to 0.5).
### Components/Axes
- **X-axis (Token)**: Categorical labels representing input/output tokens:
- `last_q` (last question token)
- `first_answer` (first answer token)
- `second_answer` (second answer token)
- `exact_answer_before_first` (exact answer before first)
- `exact_answer_first` (exact answer first)
- `exact_answer_last` (exact answer last)
- `exact_answer_after_last` (exact answer after last)
- Numerical tokens: `30`, `28`, `26`, `24`, `22`, `20`, `18`, `16`, `14`, `12`, `10`, `8`, `7`, `6`, `5`, `4`, `3`, `2`, `1`, `-1`
- **Y-axis (Layer)**: Numerical labels from `0` to `30`, representing model layers.
- **Legend**: Color scale from `0.5` (lightest blue) to `1.0` (darkest blue), indicating attention value magnitude.
### Detailed Analysis
- **Token-Layer Patterns**:
- **`first_answer` and `second_answer`**: Show the darkest blue values (highest attention) in layers `10–20`, suggesting these layers prioritize answer-related tokens.
- **`exact_answer_before_first` and `exact_answer_first`**: High attention in layers `12–18`, indicating mid-layers focus on exact answer alignment.
- **`last_q`**: Moderate attention (medium blue) in layers `14–22`, showing mid-to-late layers process the last question token.
- **Numerical tokens (`30`, `28`, etc.)**: Lighter blue values across most layers, with slight increases in layers `10–20`, possibly reflecting positional encoding or sequential processing.
- **`exact_answer_after_last`**: High attention in layers `20–28`, suggesting late layers refine answer precision post-final token.
- **Color Consistency**:
- Darkest blue (`1.0`) appears in mid-layers (`10–20`) for answer-related tokens, matching the legend.
- Lightest blue (`0.5`) dominates top (`0–5`) and bottom (`26–30`) layers, indicating lower attention in these regions.
### Key Observations
1. **Mid-Layer Dominance**: Layers `10–20` exhibit the highest attention values for answer-related tokens, suggesting critical processing occurs in these layers.
2. **Token-Specific Trends**:
- `first_answer` and `second_answer` show peak attention in layers `12–16`.
- `exact_answer_after_last` peaks in layers `24–28`, indicating late-layer refinement.
3. **Layer Gradient**: Attention values generally decrease toward the top (`0–5`) and bottom (`26–30`) layers, with mid-layers acting as the "attention hub."
### Interpretation
The heatmap reveals that the model's attention is concentrated in mid-layers (`10–20`) for answer-related tokens, highlighting their role in processing and refining answers. The `last_q` token's moderate attention in mid-to-late layers suggests it provides contextual grounding for answer generation. The lower attention in top and bottom layers may indicate these regions handle initial input encoding (`0–5`) and final output formatting (`26–30`), respectively. The numerical tokens' lighter values imply they serve as positional markers rather than semantic content. This pattern aligns with typical transformer architectures, where mid-layers capture complex relationships while early/late layers handle simpler tasks.