\n
## Charts: Reinforcement Learning Reward Curves
### Overview
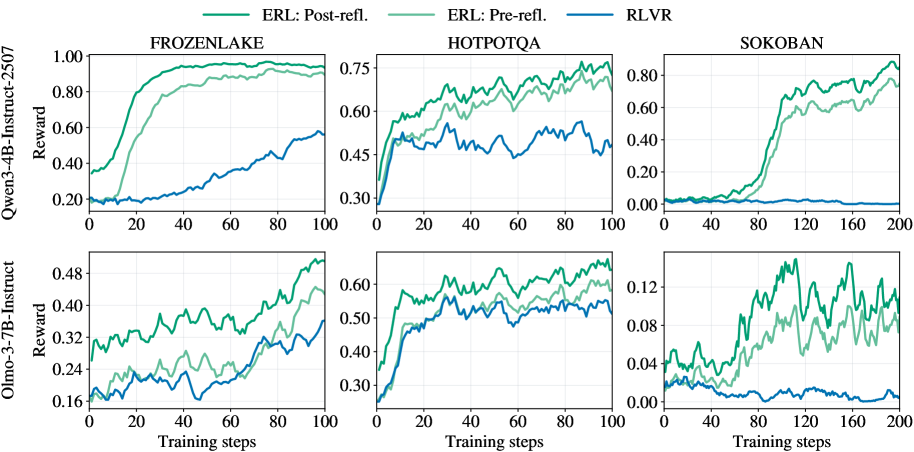
The image presents six line charts, arranged in a 2x3 grid, displaying reward curves for different reinforcement learning algorithms across three environments: FrozenLake, HotpotQA, and Sokoban. Two model sizes are compared: Owen-3-4B-Instruct-2507 and Olmo-3-7B-Instruct. The algorithms are ERL (with pre- and post-reflection) and RLVR. The charts show how the reward changes with the number of training steps.
### Components/Axes
* **Y-axis (Vertical):** Reward. Scales vary per chart, ranging from approximately 0.00 to 1.00.
* **X-axis (Horizontal):** Training steps. Scales vary per chart, ranging from 0 to 200.
* **Lines:**
* ERL: Post-refl. (Light Green)
* ERL: Pre-refl. (Medium Turquoise)
* RLVR (Dark Blue)
* **Chart Titles (Top Row):** FROZENLAKE, HOTPOTQA, SOKOBAN
* **Y-axis Labels (Left Column):** Owen-3-4B-Instruct-2507 Reward, Olmo-3-7B-Instruct Reward
* **X-axis Labels (Bottom Row):** Training steps, Training steps, Training steps
### Detailed Analysis or Content Details
**1. FrozenLake (Owen-3-4B-Instruct-2507)**
* **Trend:** All three lines generally slope upwards, indicating increasing reward with training. ERL Post-refl. shows the steepest initial increase.
* **Data Points (approximate):**
* ERL Post-refl.: Starts at ~0.20, reaches ~0.95 at 100 steps.
* ERL Pre-refl.: Starts at ~0.20, reaches ~0.75 at 100 steps.
* RLVR: Starts at ~0.25, reaches ~0.50 at 100 steps.
**2. HotpotQA (Owen-3-4B-Instruct-2507)**
* **Trend:** All lines fluctuate, but generally show an upward trend. ERL Post-refl. consistently achieves the highest reward.
* **Data Points (approximate):**
* ERL Post-refl.: Starts at ~0.45, reaches ~0.75 at 100 steps.
* ERL Pre-refl.: Starts at ~0.40, reaches ~0.60 at 100 steps.
* RLVR: Starts at ~0.40, reaches ~0.50 at 100 steps.
**3. Sokoban (Owen-3-4B-Instruct-2507)**
* **Trend:** All lines show an upward trend, but with more significant fluctuations. ERL Post-refl. shows the most rapid increase towards the end of the training.
* **Data Points (approximate):**
* ERL Post-refl.: Starts at ~0.05, reaches ~0.80 at 200 steps.
* ERL Pre-refl.: Starts at ~0.05, reaches ~0.40 at 200 steps.
* RLVR: Starts at ~0.02, reaches ~0.20 at 200 steps.
**4. FrozenLake (Olmo-3-7B-Instruct)**
* **Trend:** Similar to the Owen model, all lines increase with training. ERL Post-refl. shows the fastest initial growth.
* **Data Points (approximate):**
* ERL Post-refl.: Starts at ~0.15, reaches ~0.48 at 100 steps.
* ERL Pre-refl.: Starts at ~0.15, reaches ~0.35 at 100 steps.
* RLVR: Starts at ~0.20, reaches ~0.30 at 100 steps.
**5. HotpotQA (Olmo-3-7B-Instruct)**
* **Trend:** All lines fluctuate and generally increase. ERL Post-refl. consistently has the highest reward.
* **Data Points (approximate):**
* ERL Post-refl.: Starts at ~0.30, reaches ~0.60 at 100 steps.
* ERL Pre-refl.: Starts at ~0.30, reaches ~0.50 at 100 steps.
* RLVR: Starts at ~0.30, reaches ~0.40 at 100 steps.
**6. Sokoban (Olmo-3-7B-Instruct)**
* **Trend:** All lines show an upward trend with fluctuations. ERL Post-refl. demonstrates the most significant increase towards the end of training.
* **Data Points (approximate):**
* ERL Post-refl.: Starts at ~0.02, reaches ~0.12 at 200 steps.
* ERL Pre-refl.: Starts at ~0.02, reaches ~0.08 at 200 steps.
* RLVR: Starts at ~0.01, reaches ~0.06 at 200 steps.
### Key Observations
* ERL Post-refl. consistently outperforms ERL Pre-refl. and RLVR across all environments and model sizes.
* The performance gap between the algorithms is most pronounced in the Sokoban environment.
* The Olmo-3-7B-Instruct model generally achieves lower rewards than the Owen-3-4B-Instruct-2507 model, especially in the Sokoban environment.
* All algorithms show diminishing returns as training progresses, with the rate of reward increase slowing down.
### Interpretation
The data suggests that the post-reflection technique significantly improves the performance of the ERL algorithm in reinforcement learning tasks. The consistent outperformance of ERL Post-refl. across different environments indicates that this technique is robust and effective. The lower rewards achieved by the Olmo-3-7B-Instruct model, particularly in Sokoban, could be due to several factors, including differences in model architecture, training data, or hyperparameter settings. The diminishing returns observed in all algorithms suggest that further training may not yield substantial improvements in performance. The fluctuations in reward curves, especially in HotpotQA, may indicate the stochastic nature of the environment or the learning process. The Sokoban environment appears to be the most challenging, as evidenced by the lower overall reward values and the greater variability in performance. This could be due to the complexity of the task or the difficulty of exploring the state space.