TECHNICAL ASSET FINGERPRINT
74cf36cbba35555375dddd90
Click to view fullscreen
Press ESC or click to close
FOUND IN PAPERS
EXPERT: healer-alpha-free VERSION 1
RUNTIME: free/openrouter/healer-alpha
INTEL_VERIFIED
\n
## Grouped Bar Chart: Model Accuracy Comparison
### Overview
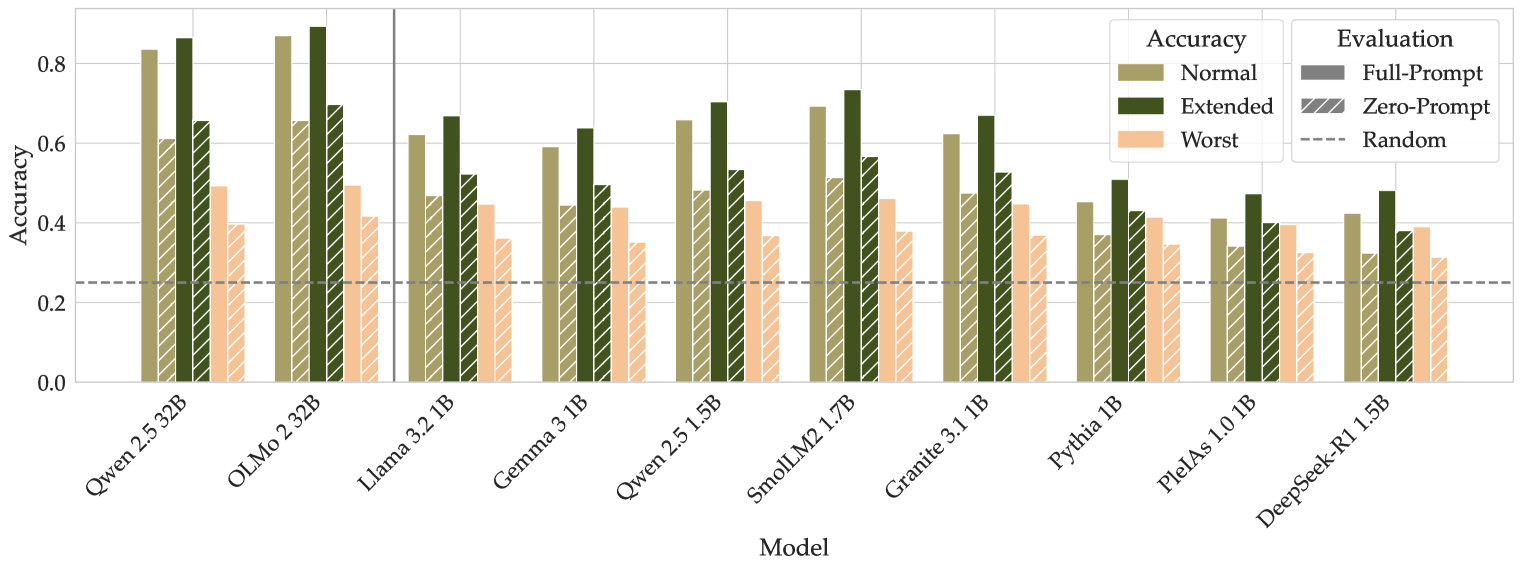
The image displays a grouped bar chart comparing the accuracy of ten different language models under various evaluation conditions. The chart evaluates each model's performance across three accuracy tiers (Normal, Extended, Worst) and two primary evaluation methods (Full-Prompt, Zero-Prompt), with a baseline for Random performance.
### Components/Axes
* **Chart Type:** Grouped bar chart.
* **X-Axis (Horizontal):** Labeled "Model". It lists ten distinct language models. From left to right:
1. Qwen 2.5 32B
2. OLMo 2 32B
3. Llama 3.2 1B
4. Gemma 3 1B
5. Qwen 2.5 1.5B
6. SmolLM2 1.7B
7. Granite 3.1 1B
8. Pythia 1B
9. PleIAs 1.0 1B
10. DeepSeek-R1 1.5B
* **Y-Axis (Vertical):** Labeled "Accuracy". The scale runs from 0.0 to 0.8, with major gridlines at intervals of 0.2.
* **Legend (Top-Right Corner):** Contains two sections.
* **Accuracy (Color Key):**
* Normal: Olive green solid bar.
* Extended: Dark forest green solid bar.
* Worst: Light peach/salmon solid bar.
* **Evaluation (Pattern Key):**
* Full-Prompt: Solid bar (no pattern).
* Zero-Prompt: Bar with diagonal hatching (\\).
* Random: A horizontal dashed grey line across the chart at y=0.25.
* **Baseline:** A horizontal dashed grey line labeled "Random" in the legend, positioned at an accuracy value of 0.25.
### Detailed Analysis
For each model, there are two groups of bars: one for "Full-Prompt" (solid) and one for "Zero-Prompt" (hatched). Within each group, three bars represent the "Normal", "Extended", and "Worst" accuracy tiers.
**Trend Verification:** Across all models, the "Extended" accuracy (dark green) is consistently the highest bar in its group, followed by "Normal" (olive), and then "Worst" (peach). The "Full-Prompt" evaluation (solid bars) generally yields higher accuracy than the "Zero-Prompt" evaluation (hatched bars) for the same accuracy tier.
**Data Points by Model (Approximate Values):**
1. **Qwen 2.5 32B:**
* *Full-Prompt:* Normal ~0.83, Extended ~0.86, Worst ~0.49.
* *Zero-Prompt:* Normal ~0.61, Extended ~0.65, Worst ~0.40.
2. **OLMo 2 32B:**
* *Full-Prompt:* Normal ~0.87, Extended ~0.89, Worst ~0.50.
* *Zero-Prompt:* Normal ~0.66, Extended ~0.70, Worst ~0.42.
3. **Llama 3.2 1B:**
* *Full-Prompt:* Normal ~0.62, Extended ~0.67, Worst ~0.45.
* *Zero-Prompt:* Normal ~0.47, Extended ~0.52, Worst ~0.36.
4. **Gemma 3 1B:**
* *Full-Prompt:* Normal ~0.59, Extended ~0.64, Worst ~0.44.
* *Zero-Prompt:* Normal ~0.45, Extended ~0.50, Worst ~0.35.
5. **Qwen 2.5 1.5B:**
* *Full-Prompt:* Normal ~0.66, Extended ~0.71, Worst ~0.46.
* *Zero-Prompt:* Normal ~0.49, Extended ~0.54, Worst ~0.37.
6. **SmolLM2 1.7B:**
* *Full-Prompt:* Normal ~0.70, Extended ~0.74, Worst ~0.46.
* *Zero-Prompt:* Normal ~0.52, Extended ~0.57, Worst ~0.38.
7. **Granite 3.1 1B:**
* *Full-Prompt:* Normal ~0.63, Extended ~0.67, Worst ~0.45.
* *Zero-Prompt:* Normal ~0.48, Extended ~0.53, Worst ~0.37.
8. **Pythia 1B:**
* *Full-Prompt:* Normal ~0.45, Extended ~0.51, Worst ~0.42.
* *Zero-Prompt:* Normal ~0.37, Extended ~0.43, Worst ~0.35.
9. **PleIAs 1.0 1B:**
* *Full-Prompt:* Normal ~0.41, Extended ~0.48, Worst ~0.40.
* *Zero-Prompt:* Normal ~0.34, Extended ~0.40, Worst ~0.33.
10. **DeepSeek-R1 1.5B:**
* *Full-Prompt:* Normal ~0.43, Extended ~0.49, Worst ~0.39.
* *Zero-Prompt:* Normal ~0.32, Extended ~0.38, Worst ~0.31.
### Key Observations
1. **Top Performers:** The two largest models, **OLMo 2 32B** and **Qwen 2.5 32B**, achieve the highest accuracies, with OLMo 2 32B showing a slight edge. Their "Extended/Full-Prompt" accuracy approaches 0.9.
2. **Performance Drop with Zero-Prompt:** All models experience a significant drop in accuracy when moving from "Full-Prompt" to "Zero-Prompt" evaluation. The drop is most pronounced for the higher-performing models.
3. **Model Size Correlation:** There is a general trend where the 32B parameter models outperform the 1B-1.7B parameter models. However, among the smaller models, **SmolLM2 1.7B** and **Qwen 2.5 1.5B** perform notably better than others like Pythia 1B or PleIAs 1.0 1B.
4. **"Worst" Case Performance:** The "Worst" accuracy tier (peach bars) shows less variance between models and evaluation methods compared to the "Normal" and "Extended" tiers. Most "Worst" scores cluster between 0.3 and 0.5.
5. **Baseline Comparison:** All models, even under "Zero-Prompt/Worst" conditions, perform above the "Random" baseline of 0.25, except for DeepSeek-R1 1.5B's Zero-Prompt/Worst score which is very close to it (~0.31).
### Interpretation
This chart provides a multifaceted evaluation of language model robustness and capability. The data suggests several key insights:
* **Prompt Engineering is Critical:** The substantial gap between "Full-Prompt" and "Zero-Prompt" results across all models underscores the heavy reliance of current LLMs on detailed instructions to achieve high performance. Their ability to infer task requirements without explicit prompting ("Zero-Prompt") is significantly weaker.
* **Scale Still Matters:** The clear performance advantage of the 32B models indicates that, for this evaluation benchmark, increased model scale correlates strongly with higher accuracy and robustness.
* **Performance Tiers Reveal Robustness:** The consistent hierarchy of `Extended > Normal > Worst` accuracy within each model/evaluation group suggests that the benchmark likely has a gradient of difficulty. Models that maintain higher "Worst" scores may be more robust to adversarial or edge-case scenarios.
* **Benchmarking Small Models:** The chart allows for direct comparison of similarly sized models (1B-1.7B). SmolLM2 1.7B emerges as a standout among the smaller models, suggesting its architecture or training data may be more effective for this specific task domain.
* **The "Random" Baseline:** The 0.25 random baseline implies the task likely involves a four-choice selection (e.g., multiple-choice question). All models demonstrate learned capability beyond random guessing.
In summary, this visualization is not just a simple accuracy leaderboard. It reveals the conditional nature of LLM performance, highlighting the importance of prompt design, the benefits of scale, and providing a nuanced view of model robustness across different evaluation scenarios.
DECODING INTELLIGENCE...