## Bar Chart: Model Accuracy Comparison Across Evaluation Methods
### Overview
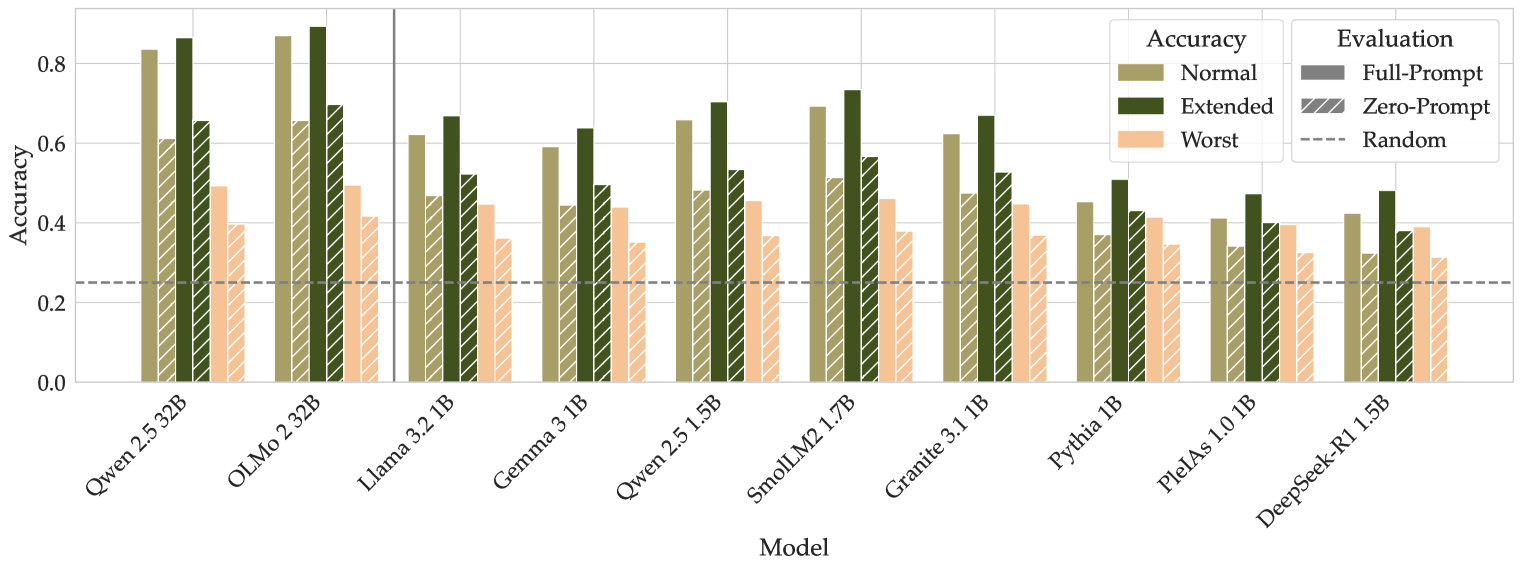
The chart compares the accuracy of various language models (LMs) under three evaluation methods: Normal, Extended, and Worst. It also includes three evaluation types: Full-Prompt, Zero-Prompt, and Random. The y-axis represents accuracy (0–0.8), while the x-axis lists models like Qwen, OLMo, Llama, Gemma, and others. A dashed line at ~0.3 marks the Random baseline.
### Components/Axes
- **X-Axis (Models)**:
- Qwen 2.5 32B, OLMo 2.32B, Llama 3.2 1B, Gemma 3 1B, Qwen 2.5 1.5B, SmolLM2 1.7B, Granite 3.1 1B, Pythia 1B, Pleias 1.0 1B, DeepSeek-R1 1.5B.
- **Y-Axis (Accuracy)**:
- Scale from 0.0 to 0.8 in increments of 0.2.
- **Legend (Evaluation Methods)**:
- **Normal**: Solid olive-green bars.
- **Extended**: Solid dark-green bars.
- **Worst**: Solid salmon-pink bars.
- **Full-Prompt**: Diagonal-striped olive-green bars.
- **Zero-Prompt**: Diagonal-striped dark-green bars.
- **Random**: Dashed gray line (~0.3 accuracy).
### Detailed Analysis
1. **Model Performance**:
- **Qwen 2.5 32B**:
- Normal: ~0.82, Extended: ~0.85, Worst: ~0.48.
- **OLMo 2.32B**:
- Normal: ~0.85, Extended: ~0.70, Worst: ~0.45.
- **Llama 3.2 1B**:
- Normal: ~0.60, Extended: ~0.65, Worst: ~0.35.
- **Gemma 3 1B**:
- Normal: ~0.58, Extended: ~0.52, Worst: ~0.32.
- **Qwen 2.5 1.5B**:
- Normal: ~0.65, Extended: ~0.55, Worst: ~0.38.
- **SmolLM2 1.7B**:
- Normal: ~0.68, Extended: ~0.58, Worst: ~0.36.
- **Granite 3.1 1B**:
- Normal: ~0.70, Extended: ~0.50, Worst: ~0.34.
- **Pythia 1B**:
- Normal: ~0.42, Extended: ~0.45, Worst: ~0.30.
- **Pleias 1.0 1B**:
- Normal: ~0.40, Extended: ~0.42, Worst: ~0.32.
- **DeepSeek-R1 1.5B**:
- Normal: ~0.38, Extended: ~0.40, Worst: ~0.28.
2. **Evaluation Methods**:
- **Full-Prompt** (diagonal-striped olive-green):
- Consistently higher than Zero-Prompt for most models (e.g., Qwen 2.5 32B: ~0.82 vs. ~0.65).
- **Zero-Prompt** (diagonal-striped dark-green):
- Outperforms Random but lags behind Full-Prompt (e.g., OLMo 2.32B: ~0.70 vs. ~0.85).
- **Random** (dashed gray line):
- Baseline at ~0.3; all models exceed this except DeepSeek-R1 1.5B in Worst (~0.28).
### Key Observations
- **Trends**:
- Extended evaluations generally outperform Normal and Worst for most models (e.g., OLMo 2.32B: Extended ~0.70 vs. Normal ~0.85).
- Worst evaluations consistently yield the lowest accuracy across all models.
- Full-Prompt evaluations achieve the highest accuracy for larger models (e.g., Qwen 2.5 32B: ~0.82).
- **Outliers**:
- DeepSeek-R1 1.5B underperforms in all categories, with Worst accuracy (~0.28) below the Random baseline.
- Pythia 1B and Pleias 1.0 1B show minimal differences between evaluation methods.
### Interpretation
The data demonstrates that **evaluation method significantly impacts model performance**. Full-Prompt evaluations consistently yield higher accuracy than Zero-Prompt and Random, suggesting that prompt design is critical for model effectiveness. Extended evaluations often outperform Normal evaluations, indicating that additional context or constraints improve results. However, the Worst evaluation method universally reduces accuracy, highlighting its inefficacy. Larger models (e.g., Qwen, OLMo) maintain higher performance across evaluations, while smaller models (e.g., Pythia, Pleias) struggle, particularly in Worst scenarios. The Random baseline (~0.3) serves as a benchmark, with most models exceeding it except in extreme cases like DeepSeek-R1 1.5B. This underscores the importance of tailored evaluation strategies for different model sizes and tasks.