## Bar Chart: Decreasing Value Trend
### Overview
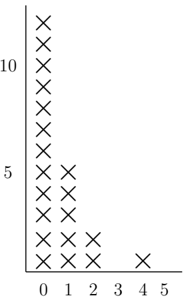
The image depicts a vertical bar chart with six bars decreasing in height from left to right. The chart uses a single data series labeled "X" in black, with values plotted against a y-axis ranging from 5 to 10 and an x-axis labeled 0 to 5.
### Components/Axes
- **X-axis**: Labeled with integer values 0, 1, 2, 3, 4, 5 (horizontal axis at the bottom).
- **Y-axis**: Labeled with integer values 5, 6, 7, 8, 9, 10 (vertical axis on the left).
- **Legend**: Positioned on the right side of the chart, featuring a black square labeled "X".
- **Bars**: Six vertical bars aligned with x-axis values, decreasing in height from left to right.
### Detailed Analysis
- **Bar Heights**:
- x=0: 10 units (tallest bar).
- x=1: 9 units.
- x=2: 8 units.
- x=3: 7 units.
- x=4: 6 units.
- x=5: 5 units (shortest bar).
- **Trend**: A linear decrease of 1 unit per x-increment, with no deviations or outliers.
### Key Observations
- The chart shows a perfect linear relationship between x and y, with y decreasing by 1 unit for every 1-unit increase in x.
- All bars are fully filled with the "X" pattern, matching the legend's black color.
- No gaps or missing data points between x=0 and x=5.
### Interpretation
The data suggests a deterministic, inverse relationship between the x and y variables, where y is strictly dependent on x (y = 10 - x). The absence of variability or noise implies a controlled or theoretical scenario rather than real-world data. The consistent decrement could represent a decay model, resource depletion, or a simplified mathematical function. The uniformity of the "X" pattern across all bars emphasizes categorical consistency in the dataset.