## Flowchart Diagram: Confidence and Hallucination Analysis of AI Response
### Overview
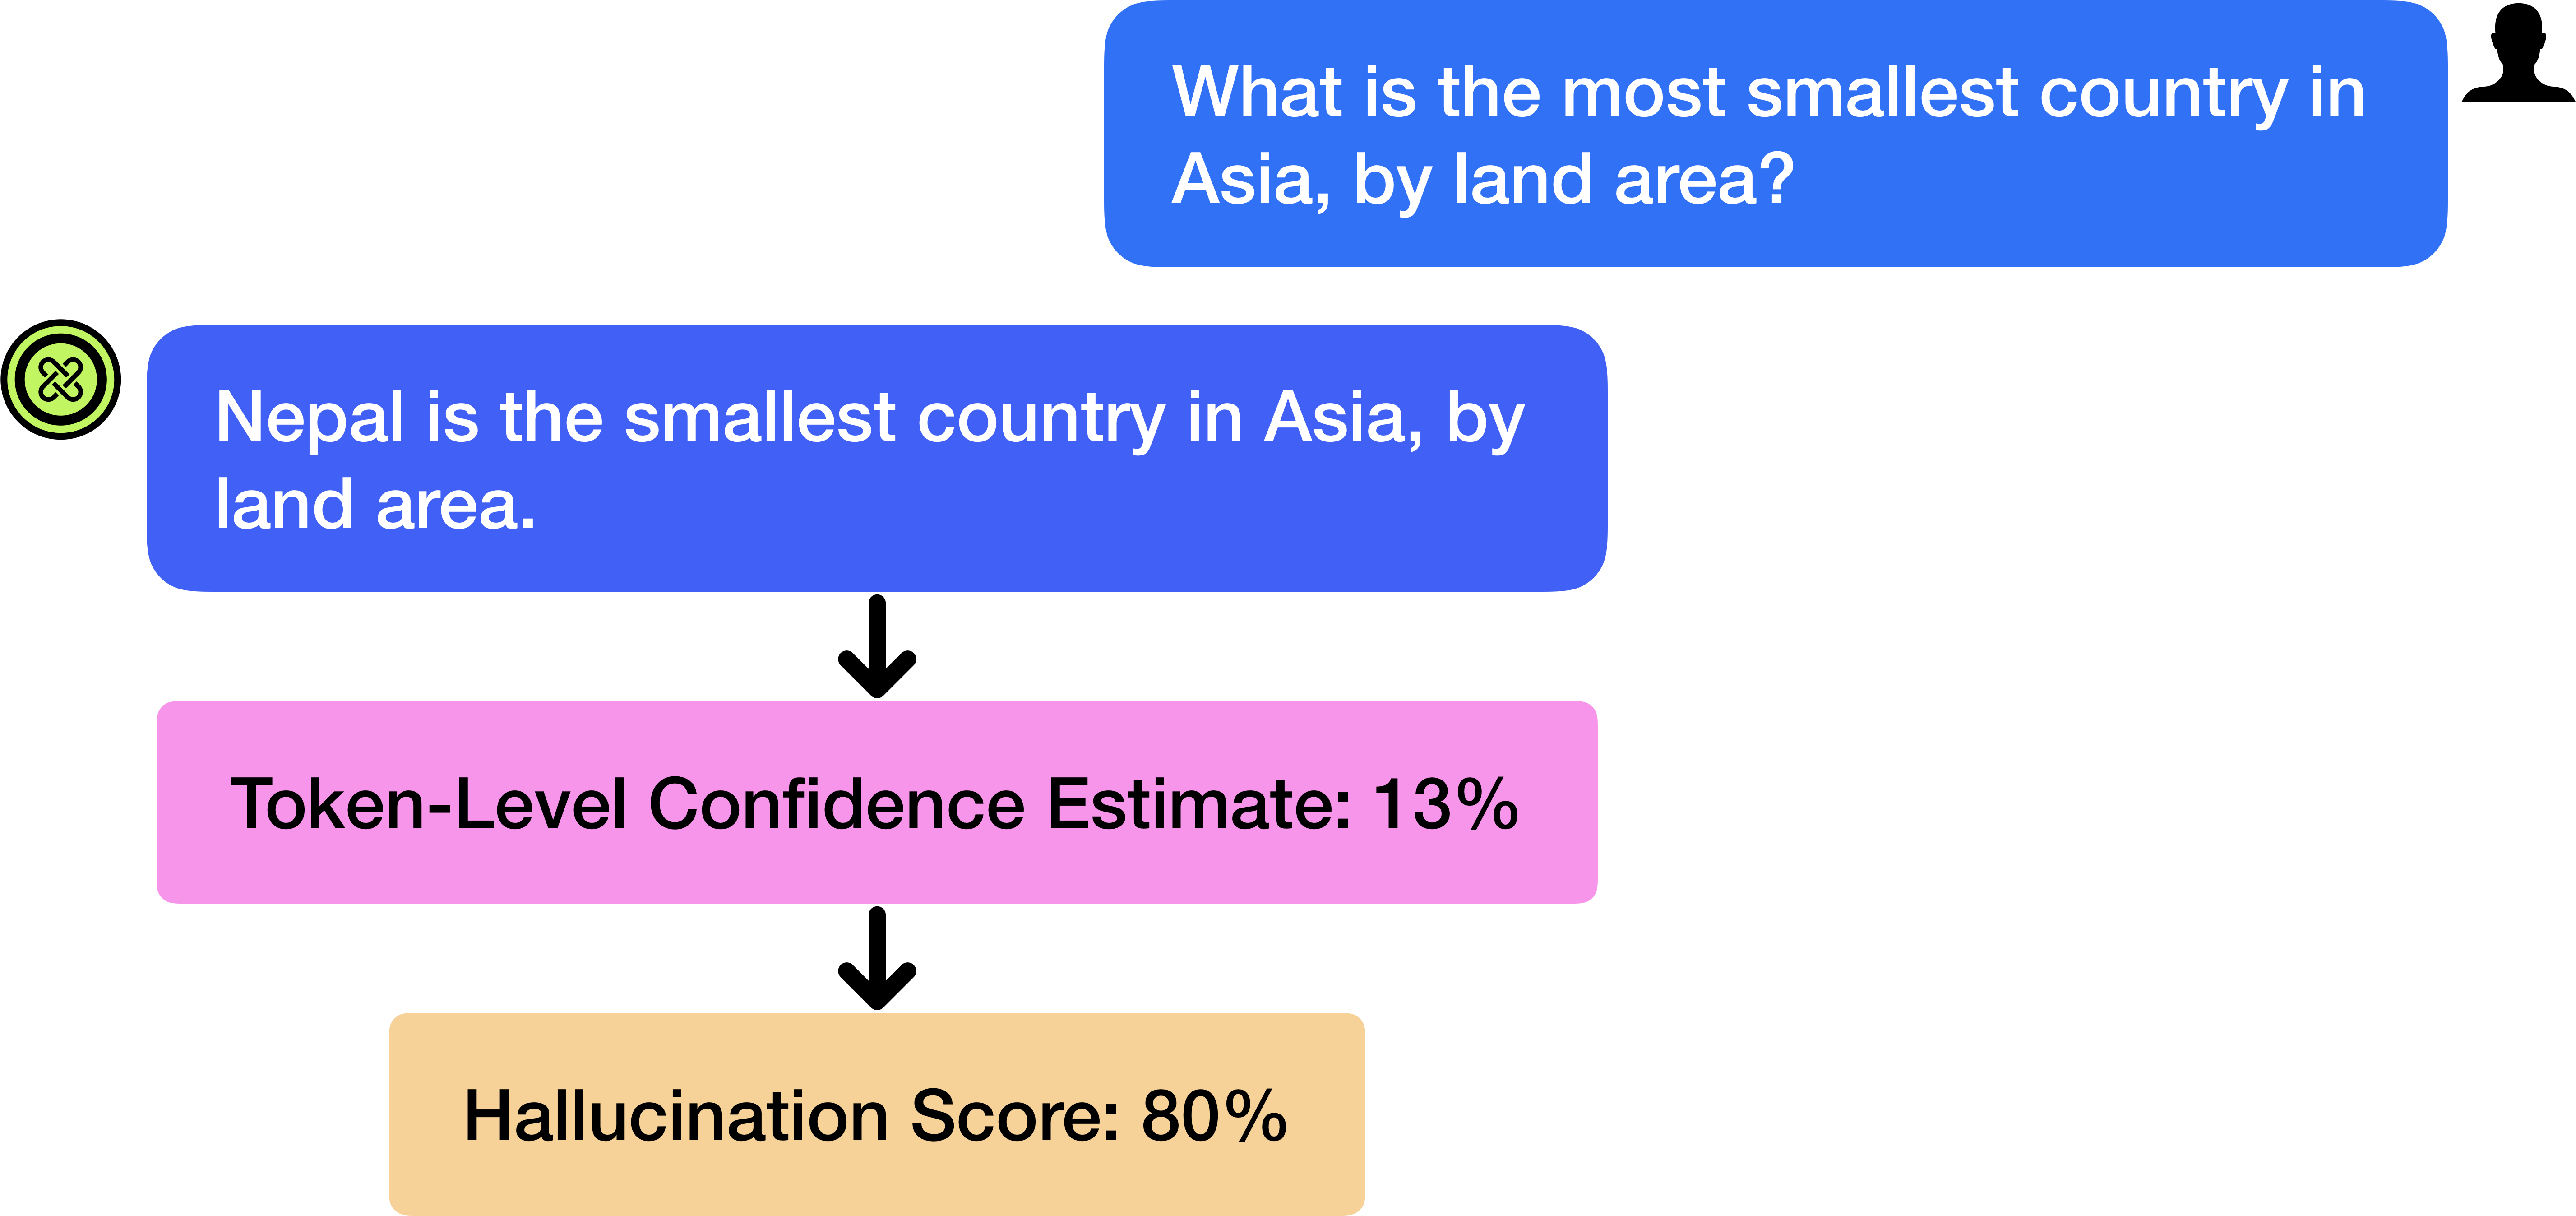
The diagram illustrates a three-stage process analyzing an AI's response to a factual question. It shows a question about the smallest country in Asia by land area, followed by the AI's answer, confidence metrics, and hallucination risk assessment. The visual flow moves from top to bottom, with color-coded components indicating different stages of analysis.
### Components/Axes
1. **Top Box (Blue)**
- Text: "What is the most smallest country in Asia, by land area?"
- Contains a user icon in the top-right corner
- Represents the input question
2. **Middle Box (Pink)**
- Text: "Token-Level Confidence Estimate: 13%"
- Positioned directly below the blue box with a downward arrow
- Represents confidence assessment
3. **Bottom Box (Orange)**
- Text: "Hallucination Score: 80%"
- Positioned below the pink box with a downward arrow
- Represents risk assessment
4. **Connecting Elements**
- Black downward arrows between components
- Color-coded boxes (blue → pink → orange) creating visual hierarchy
### Detailed Analysis
- **Question/Answer Pair**
- Question: "What is the most smallest country in Asia, by land area?"
- Answer: "Nepal is the smallest country in Asia, by land area."
- Spatial relationship: Answer appears in the same box as the question
- **Confidence Metrics**
- Token-Level Confidence: 13% (pink box)
- Position: Directly below question/answer box
- Visual weight: Medium-sized box with bold text
- **Risk Assessment**
- Hallucination Score: 80% (orange box)
- Position: Bottom-most component
- Visual emphasis: Largest box with highest numerical value
### Key Observations
1. **Confidence-Hallucination Inversion**
- Despite high hallucination risk (80%), confidence remains low (13%)
- Suggests model uncertainty about its own response
2. **Geographical Inaccuracy**
- Nepal's actual land area: 147,181 km²
- Smallest Asian country by land area: Maldives (298 km²)
- Model's answer contains factual error
3. **Visual Hierarchy**
- Color progression (blue → pink → orange) creates descending importance
- Arrows establish clear causal flow from question to analysis
### Interpretation
The diagram reveals critical limitations in AI fact-checking capabilities:
1. **Model Uncertainty**: The 13% confidence score indicates the system recognizes its response as unreliable
2. **Hallucination Paradox**: High hallucination score (80%) suggests the model generated content not grounded in training data
3. **Factual Error**: The response contains incorrect information about Asian geography
4. **Design Implications**: The color-coded flow effectively communicates risk levels but fails to prevent misinformation
This analysis demonstrates the challenges in balancing confidence metrics with factual accuracy in AI systems, particularly for geographical knowledge where precise data exists but may not be properly weighted in the model's architecture.