# Technical Document Extraction: AI Hallucination Analysis Diagram
## 1. Overview
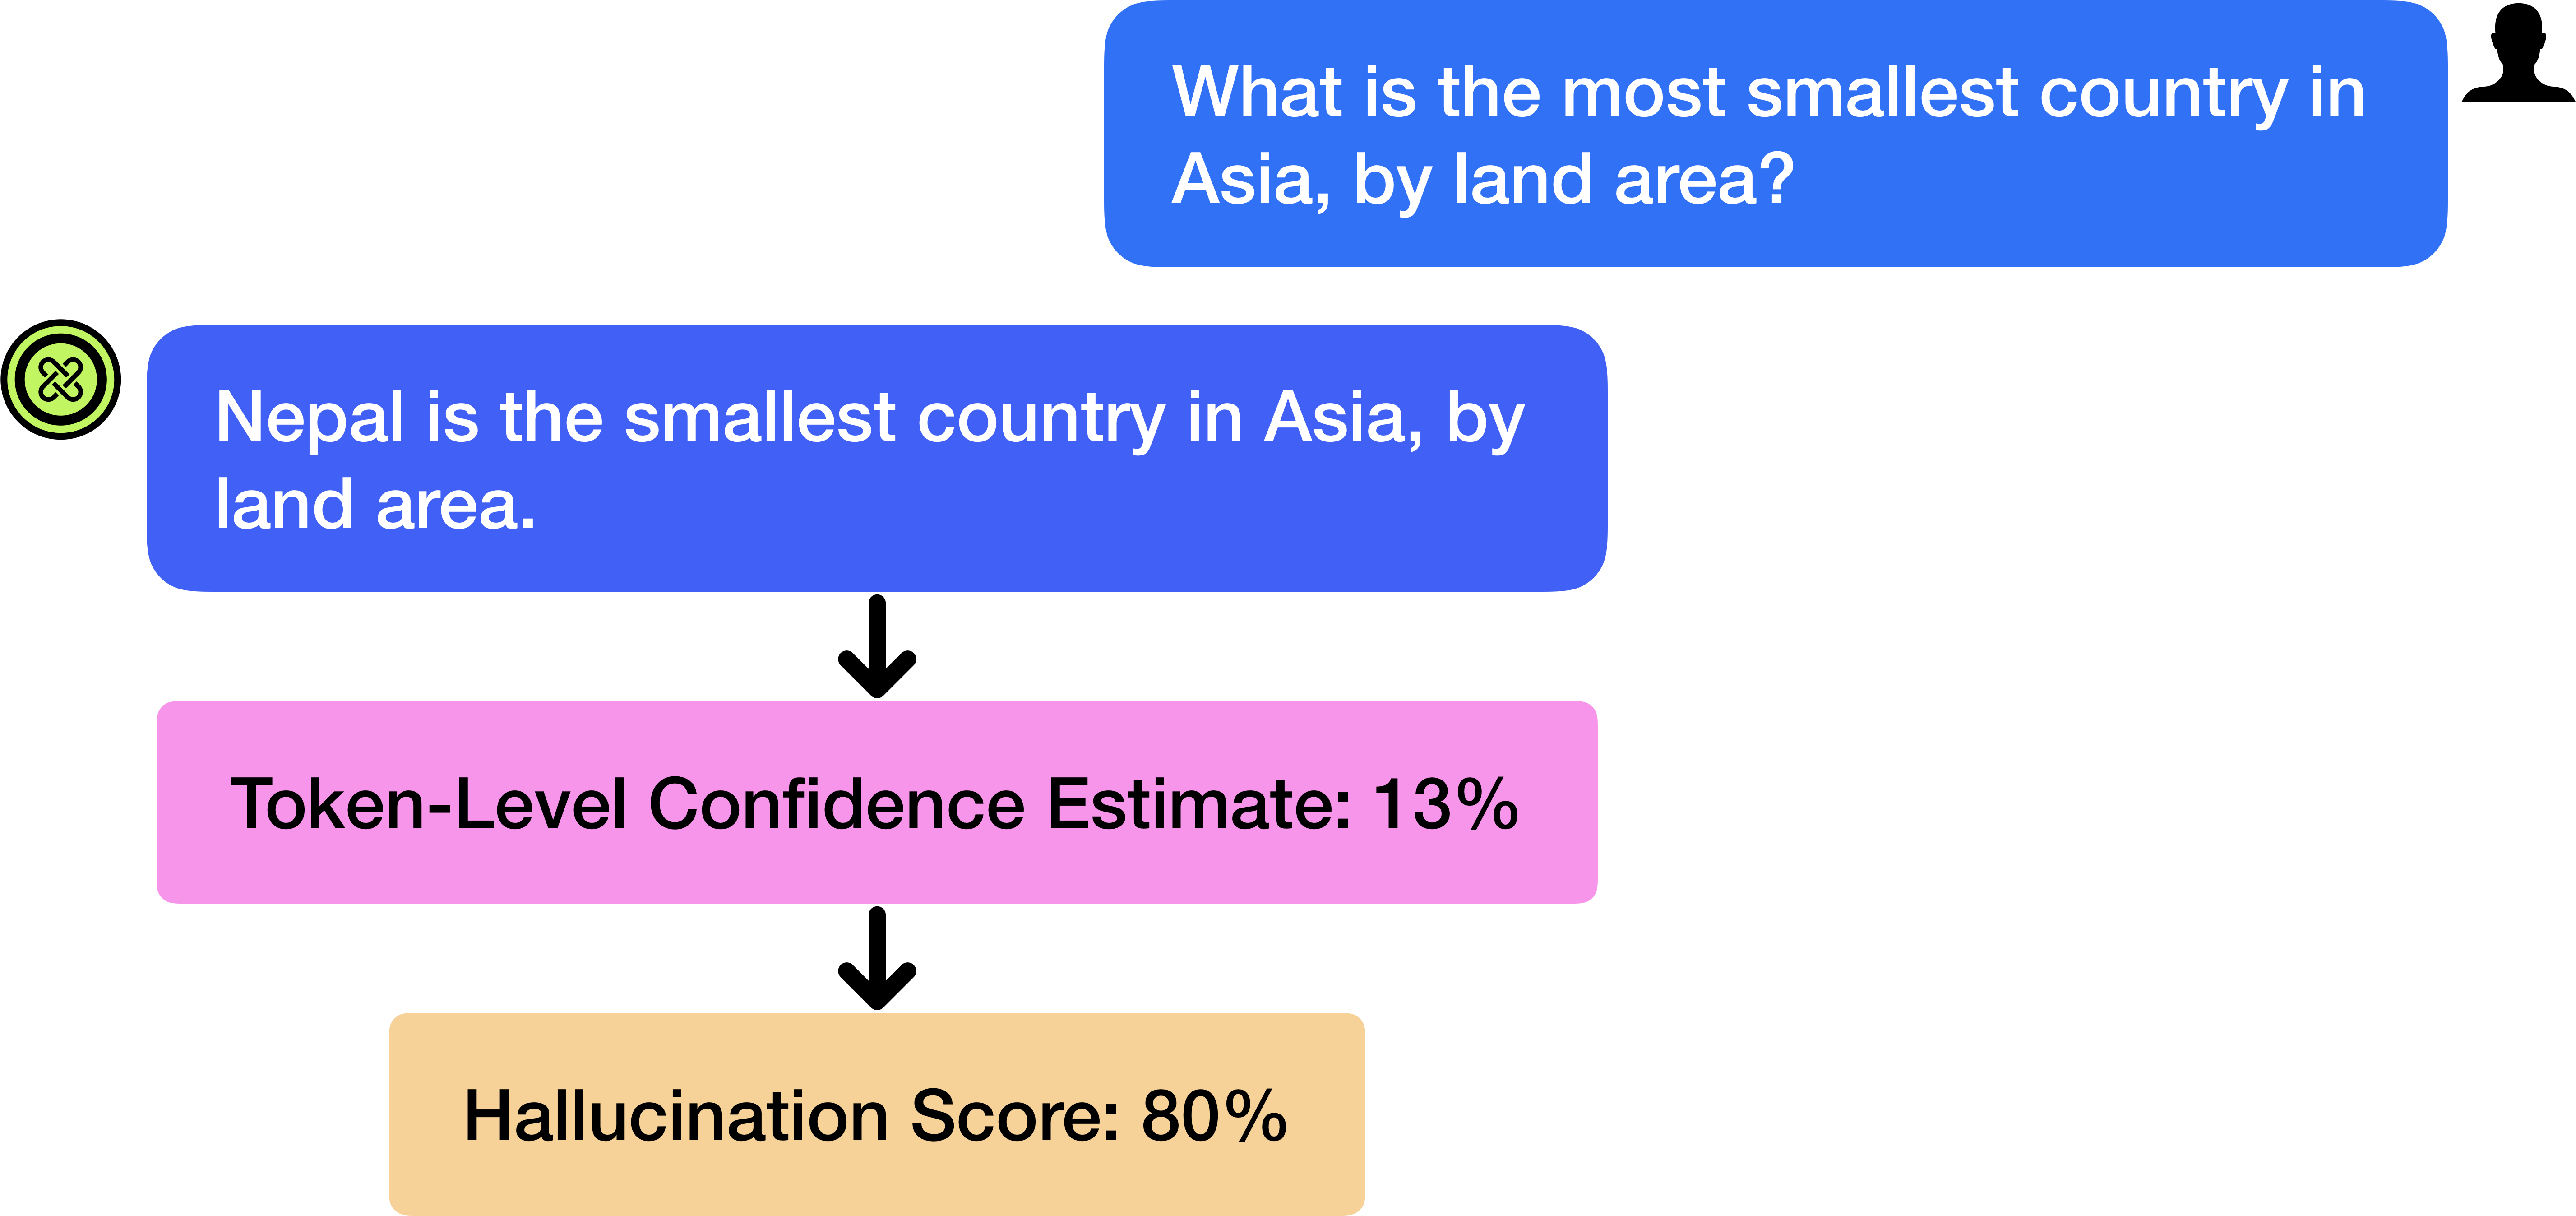
This image is a flow-based diagram illustrating a Large Language Model (LLM) interaction and the subsequent metadata analysis regarding the accuracy of the generated response. It depicts a user query, an incorrect AI response, and two diagnostic metrics indicating a high probability of error.
## 2. Component Isolation and Transcription
### Region 1: User Input (Top Right)
* **Visual Element:** A blue speech bubble associated with a black silhouette icon of a person.
* **Transcribed Text:** "What is the most smallest country in Asia, by land area?"
* **Note:** The query contains a grammatical redundancy ("most smallest").
### Region 2: AI Response (Middle Left)
* **Visual Element:** A royal blue speech bubble associated with a green circular logo containing a stylized knot/interlocking pattern.
* **Transcribed Text:** "Nepal is the smallest country in Asia, by land area."
* **Fact Check:** This statement is factually incorrect (Maldives is the smallest country in Asia), serving as the example for the following metrics.
### Region 3: Confidence Metric (Center)
* **Visual Element:** A pink rectangular block connected to the AI Response by a downward-pointing black arrow.
* **Transcribed Text:** "Token-Level Confidence Estimate: 13%"
* **Trend/Data Point:** This represents a very low confidence score from the model for the generated tokens.
### Region 4: Hallucination Metric (Bottom)
* **Visual Element:** An orange/tan rectangular block connected to the Confidence Metric by a downward-pointing black arrow.
* **Transcribed Text:** "Hallucination Score: 80%"
* **Trend/Data Point:** This represents a high probability that the information provided in the AI Response is fabricated or incorrect.
## 3. Diagram Flow and Logic
The diagram follows a vertical and diagonal flow to demonstrate a "Detection Pipeline":
1. **Input:** User asks a factual question.
2. **Output:** The AI provides a factually incorrect answer (Nepal).
3. **Analysis Step 1:** The system evaluates the internal confidence of the tokens generated, resulting in a low **13%**.
4. **Analysis Step 2:** Based on the low confidence and potentially other cross-referencing, the system assigns a high **80% Hallucination Score**.
## 4. Summary of Data Points
| Metric | Value | Interpretation |
| :--- | :--- | :--- |
| **Token-Level Confidence** | 13% | Extremely Low; indicates the model is "unsure" of its word choice. |
| **Hallucination Score** | 80% | High; indicates a high likelihood of factual error. |
| **Subject Matter** | Geography | Specifically Asian land area. |
**Language Declaration:** All text in this image is in **English**.