## Diagram: Result Orderings
### Overview
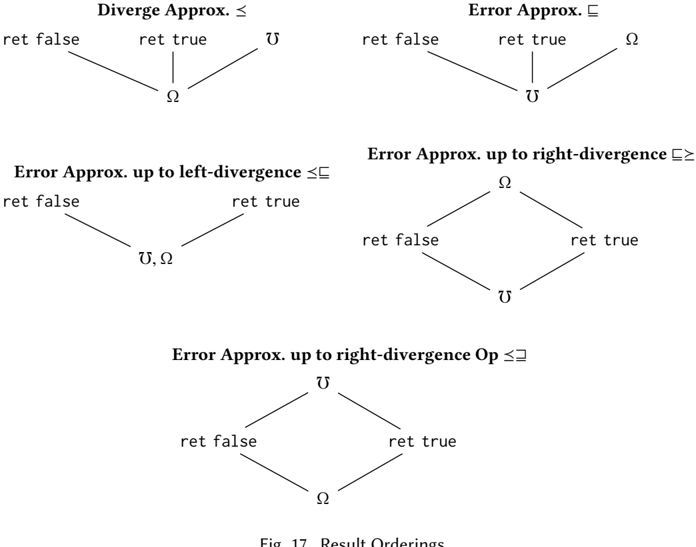
The image presents a series of diagrams illustrating different result orderings related to divergence and error approximation. Each diagram depicts a directed graph with nodes labeled "ret false", "ret true", "Ω", and "υ", representing return values and approximation symbols. The diagrams show how these values and symbols are related under different approximation conditions.
### Components/Axes
* **Nodes:**
* "ret false": Represents the return value 'false'.
* "ret true": Represents the return value 'true'.
* "Ω": Represents a specific approximation symbol.
* "υ": Represents a specific approximation symbol.
* **Edges:** Directed lines connecting the nodes, indicating relationships or orderings.
* **Titles:** Each diagram has a title indicating the type of approximation being represented:
* "Diverge Approx. ≤"
* "Error Approx. ⊆"
* "Error Approx. up to left-divergence ⊆"
* "Error Approx. up to right-divergence ⊇"
* "Error Approx. up to right-divergence Op ⊆"
* **Figure Caption:** "Fig. 17 Result Orderings"
### Detailed Analysis
**1. Diverge Approx. ≤**
* Nodes: "ret false" (top-left), "ret true" (top-right), "Ω" (bottom-center), "υ" (top-center).
* Edges: "ret false" -> "Ω", "ret true" -> "Ω", "Ω" -> "υ".
* Trend: Both "ret false" and "ret true" lead to "Ω", which then leads to "υ".
**2. Error Approx. ⊆**
* Nodes: "ret false" (top-left), "ret true" (top-right), "Ω" (top-center), "υ" (bottom-center).
* Edges: "ret false" -> "υ", "ret true" -> "υ", "Ω" -> "υ".
* Trend: Both "ret false" and "ret true" lead to "υ", and "Ω" also leads to "υ".
**3. Error Approx. up to left-divergence ⊆**
* Nodes: "ret false" (top-left), "ret true" (top-right), "υ, Ω" (bottom-center).
* Edges: "ret false" -> "υ, Ω", "ret true" -> "υ, Ω".
* Trend: Both "ret false" and "ret true" lead to the combined node "υ, Ω".
**4. Error Approx. up to right-divergence ⊇**
* Nodes: "ret false" (left), "ret true" (right), "Ω" (bottom-center), "υ" (top-center).
* Edges: "υ" -> "ret false", "υ" -> "ret true", "ret false" -> "Ω", "ret true" -> "Ω".
* Trend: "υ" leads to both "ret false" and "ret true", which both lead to "Ω".
**5. Error Approx. up to right-divergence Op ⊆**
* Nodes: "ret false" (left), "ret true" (right), "Ω" (bottom-center), "υ" (top-center).
* Edges: "υ" -> "ret false", "υ" -> "ret true", "ret false" -> "Ω", "ret true" -> "Ω".
* Trend: "υ" leads to both "ret false" and "ret true", which both lead to "Ω".
### Key Observations
* The diagrams illustrate different relationships between return values ("ret false", "ret true") and approximation symbols ("Ω", "υ").
* The titles indicate the specific type of approximation being represented in each diagram.
* The direction of the edges indicates the flow or ordering of the values and symbols.
* The symbols "⊆" and "⊇" in the titles suggest subset and superset relationships, respectively.
### Interpretation
The diagrams likely represent different strategies or methods for approximating results in a computational process. The "ret false" and "ret true" nodes probably represent the actual results of a computation, while "Ω" and "υ" represent approximations of those results. The diagrams show how these approximations relate to the actual results under different conditions, such as divergence or error. The "up to left/right-divergence" variations likely indicate different ways of handling divergence in the approximation process. The symbols "⊆" and "⊇" suggest that some approximations are subsets or supersets of the actual results, indicating the degree of accuracy or error in the approximation. The "Op" suffix may indicate an operation or operator applied during the approximation.