\n
## Diagram: Result Orderings
### Overview
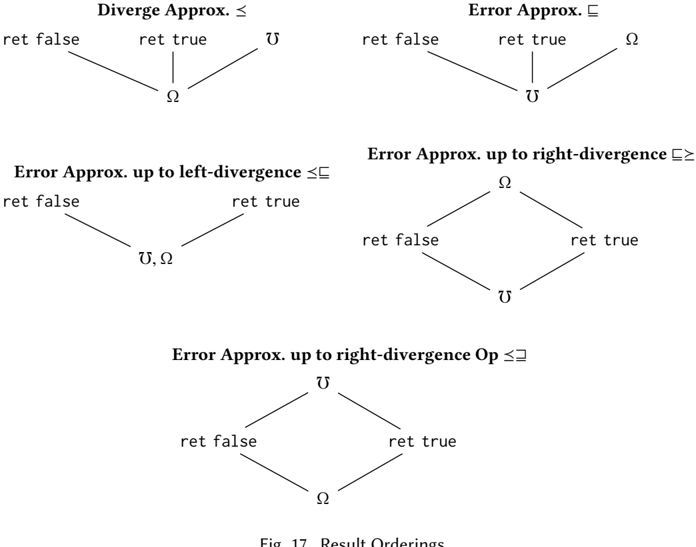
The image presents a diagram illustrating different result orderings based on approximation and error conditions. It consists of five separate tree-like structures, each representing a specific ordering scenario. Each tree branches based on boolean conditions ("ret true" or "ret false") and includes symbols representing sets (U and Ω).
### Components/Axes
The diagram does not have traditional axes. Instead, it uses branching trees to represent logical flow. The key components are:
* **Branching Nodes:** Represent decision points based on boolean conditions.
* **Leaf Nodes:** Represent the final result ("ret false" or "ret true").
* **Symbols:** U and Ω, representing sets.
* **Labels:** Each tree is labeled with a specific condition, such as "Diverge Approx. ≤", "Error Approx. ⊆", "Error Approx. up to left-divergence ≤⊆", "Error Approx. up to right-divergence ≥⊆", and "Error Approx. up to right-divergence Op ≤⊆".
* **Figure Caption:** "Fig. 17. Result Orderings" located at the bottom center.
### Detailed Analysis or Content Details
**1. Diverge Approx. ≤**
* Top Node: "Diverge Approx. ≤"
* Left Branch: "ret false"
* Right Branch: "ret true", leading to "U" and "Ω"
**2. Error Approx. ⊆**
* Top Node: "Error Approx. ⊆"
* Left Branch: "ret false"
* Right Branch: "ret true", leading to "Ω" and "U"
**3. Error Approx. up to left-divergence ≤⊆**
* Top Node: "Error Approx. up to left-divergence ≤⊆"
* Left Branch: "ret false"
* Right Branch: "ret true", leading to "U, Ω"
**4. Error Approx. up to right-divergence ≥⊆**
* Top Node: "Error Approx. up to right-divergence ≥⊆"
* Left Branch: "ret false"
* Right Branch: "ret true", leading to "Ω" and "U"
**5. Error Approx. up to right-divergence Op ≤⊆**
* Top Node: "Error Approx. up to right-divergence Op ≤⊆"
* Left Branch: "ret false"
* Right Branch: "ret true", leading to "U" and "Ω"
### Key Observations
* Each tree structure consistently starts with a condition label, branches into "ret false" and "ret true" paths, and ends with the symbols "U" and/or "Ω".
* The order of "U" and "Ω" varies between the trees, suggesting different ordering relationships based on the initial condition.
* The conditions themselves involve mathematical symbols (≤, ⊆, ≥, Op) indicating comparisons or set relationships.
### Interpretation
This diagram likely represents a decision-making process or a set of rules for determining the order of results based on different approximation and error criteria. The "ret true" and "ret false" branches represent the outcome of evaluating a condition, and the final symbols "U" and "Ω" likely represent specific results or sets of results.
The different conditions (Diverge Approx., Error Approx., etc.) define different scenarios or levels of approximation/error tolerance. The varying order of "U" and "Ω" in the final results suggests that the order of these results depends on the specific condition being met.
The use of mathematical symbols indicates a formal or mathematical context, possibly related to algorithm design, data analysis, or optimization. The diagram is a visual representation of a logical framework for handling results under different error and approximation constraints. The "Op" in the last condition is unclear without further context, but likely represents a specific operation or operator.