TECHNICAL ASSET FINGERPRINT
751ddbe81ce1bba1885ed774
Click to view fullscreen
Press ESC or click to close
FOUND IN PAPERS
EXPERT: gemini-2.0-flash VERSION 1
RUNTIME: nugit/gemini/gemini-2.0-flash
INTEL_VERIFIED
## Line Chart: Evolution of Top 10 Bridge Nodes Over Iterations
### Overview
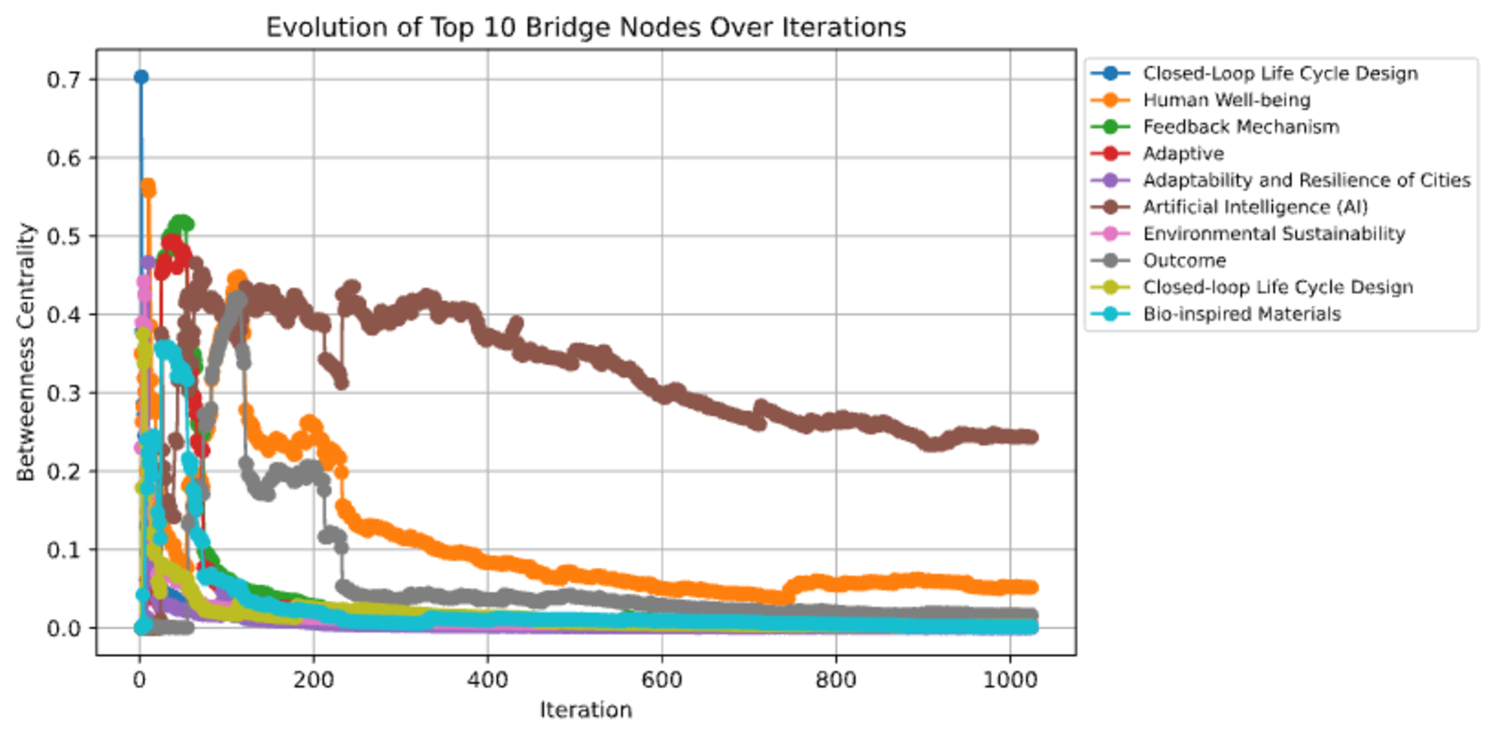
The image is a line chart that illustrates the evolution of betweenness centrality for the top 10 bridge nodes over a series of iterations. The chart displays how the importance or influence of different nodes (represented by different categories) changes as the iterations progress. The x-axis represents the iteration number, and the y-axis represents the betweenness centrality.
### Components/Axes
* **Title:** Evolution of Top 10 Bridge Nodes Over Iterations
* **X-axis:**
* Label: Iteration
* Scale: 0 to 1000, with major ticks at 0, 200, 400, 600, 800, and 1000.
* **Y-axis:**
* Label: Betweenness Centrality
* Scale: 0.0 to 0.7, with major ticks at 0.0, 0.1, 0.2, 0.3, 0.4, 0.5, 0.6, and 0.7.
* **Legend:** Located on the top-right of the chart, the legend maps the line colors to the following categories:
* Blue: Closed-Loop Life Cycle Design
* Orange: Human Well-being
* Green: Feedback Mechanism
* Red: Adaptive
* Purple: Adaptability and Resilience of Cities
* Brown: Artificial Intelligence (AI)
* Pink: Environmental Sustainability
* Gray: Outcome
* Yellow-Green: Closed-loop Life Cycle Design
* Teal: Bio-inspired Materials
### Detailed Analysis
Here's a breakdown of each data series and its trend:
1. **Closed-Loop Life Cycle Design (Blue):** Starts at approximately 0.7 at iteration 0, then rapidly decreases to near 0.0 by iteration 100, and remains relatively stable near 0.0 for the rest of the iterations.
2. **Human Well-being (Orange):** Starts at approximately 0.57 at iteration 0, decreases to approximately 0.1 at iteration 200, and then gradually decreases to approximately 0.05 by iteration 1000.
3. **Feedback Mechanism (Green):** Starts at approximately 0.52 at iteration 0, decreases rapidly to near 0.0 by iteration 100, and remains relatively stable near 0.0 for the rest of the iterations.
4. **Adaptive (Red):** Starts at approximately 0.47 at iteration 0, decreases rapidly to near 0.0 by iteration 100, and remains relatively stable near 0.0 for the rest of the iterations.
5. **Adaptability and Resilience of Cities (Purple):** Starts at approximately 0.45 at iteration 0, decreases rapidly to near 0.0 by iteration 100, and remains relatively stable near 0.0 for the rest of the iterations.
6. **Artificial Intelligence (AI) (Brown):** Starts at approximately 0.44 at iteration 0, fluctuates between 0.45 and 0.30 until iteration 800, and then stabilizes around 0.27 by iteration 1000.
7. **Environmental Sustainability (Pink):** Starts at approximately 0.42 at iteration 0, decreases rapidly to near 0.0 by iteration 100, and remains relatively stable near 0.0 for the rest of the iterations.
8. **Outcome (Gray):** Starts at approximately 0.22 at iteration 0, decreases rapidly to near 0.0 by iteration 200, and remains relatively stable near 0.0 for the rest of the iterations.
9. **Closed-loop Life Cycle Design (Yellow-Green):** Starts at approximately 0.55 at iteration 0, decreases rapidly to near 0.0 by iteration 100, and remains relatively stable near 0.0 for the rest of the iterations.
10. **Bio-inspired Materials (Teal):** Starts at approximately 0.02 at iteration 0, remains relatively stable near 0.0 for the rest of the iterations.
### Key Observations
* The "Closed-Loop Life Cycle Design" node (blue line) has the highest initial betweenness centrality, peaking at approximately 0.7, but quickly drops to near zero.
* The "Artificial Intelligence (AI)" node (brown line) maintains a relatively high betweenness centrality compared to other nodes throughout the iterations, although it decreases over time.
* Most of the nodes experience a rapid decrease in betweenness centrality within the first 200 iterations.
* The "Bio-inspired Materials" node (teal line) consistently has a very low betweenness centrality throughout the iterations.
### Interpretation
The chart suggests that the "Closed-Loop Life Cycle Design" node is initially the most influential or important bridge node, but its influence diminishes rapidly. The "Artificial Intelligence (AI)" node maintains a more sustained level of influence compared to the other nodes, indicating its continued importance as a bridge node throughout the iterations. The rapid decline in betweenness centrality for most nodes suggests that their importance as bridge nodes decreases significantly as the iterations progress. The consistently low betweenness centrality of the "Bio-inspired Materials" node indicates that it is not a significant bridge node in this context. The data demonstrates the dynamic nature of node importance in a network, where some nodes initially have high influence but lose it over time, while others maintain a more consistent level of influence.
DECODING INTELLIGENCE...
EXPERT: gemini-3.1-flash-lite-preview-free VERSION 1
RUNTIME: google-free/gemini-3.1-flash-lite-preview
INTEL_VERIFIED
## Line Chart: Evolution of Top 10 Bridge Nodes Over Iterations
### Overview
This chart illustrates the temporal evolution of "Betweenness Centrality" for ten distinct nodes within a network over approximately 1,000 iterations. The chart tracks how the relative importance (centrality) of specific concepts shifts as the system progresses. The data suggests a dynamic network where most nodes experience a brief period of high centrality early in the process, while one specific node ("Artificial Intelligence (AI)") sustains high centrality over the long term.
### Components/Axes
* **Chart Type:** Multi-series line chart.
* **X-Axis:** Labeled "Iteration," ranging from 0 to 1,000.
* **Y-Axis:** Labeled "Betweenness Centrality," ranging from 0.0 to 0.7.
* **Legend:** Positioned in the top-right quadrant. It lists 10 categories, each associated with a specific line color:
* **Blue:** Closed-Loop Life Cycle Design
* **Orange:** Human Well-being
* **Green:** Feedback Mechanism
* **Red:** Adaptive
* **Purple:** Adaptability and Resilience of Cities
* **Brown:** Artificial Intelligence (AI)
* **Pink:** Environmental Sustainability
* **Grey:** Outcome
* **Yellow/Gold:** Closed-loop Life Cycle Design (Note: This is a duplicate label of the Blue entry, but represents a distinct data series).
* **Cyan:** Bio-inspired Materials
### Detailed Analysis
The chart displays significant volatility in the first 150 iterations, followed by a stabilization phase for most variables.
* **Blue (Closed-Loop Life Cycle Design):** Starts at the maximum value of 0.7 at iteration 0. It drops precipitously, reaching near-zero values by iteration 50.
* **Brown (Artificial Intelligence (AI)):** This is the most distinct trend. It begins near 0, rises sharply to ~0.4 by iteration 100, and maintains a plateau between 0.35 and 0.45 until approximately iteration 250. Following this, it exhibits a slow, steady decay, ending at approximately 0.25 at iteration 1,000.
* **Orange (Human Well-being):** Spikes to ~0.55 at iteration 10. It undergoes a steady, multi-stage decay, dropping to ~0.2 by iteration 250, and eventually stabilizing at a low value (~0.05) from iteration 400 onwards.
* **Grey (Outcome):** Remains near 0 until iteration 100, where it spikes to ~0.4. It then drops sharply to ~0.05 by iteration 250, where it remains for the duration.
* **Other Nodes (Green, Red, Purple, Pink, Yellow, Cyan):** These nodes exhibit high volatility in the initial 0–100 iteration window. They peak at various points between 0.2 and 0.5, but all collapse to near-zero values before iteration 200 and remain negligible for the rest of the timeline.
### Key Observations
* **Dominant Node:** "Artificial Intelligence (AI)" (Brown) is the only node that maintains significant betweenness centrality throughout the entire duration of the iterations.
* **Initial Volatility:** The period between iterations 0 and 150 represents a "discovery" or "training" phase where the network structure is highly unstable, and multiple nodes compete for centrality.
* **Duplicate Labeling:** The legend contains two entries for "Closed-Loop Life Cycle Design" (Blue and Yellow). The Blue series starts at 0.7, while the Yellow series starts at ~0.35, indicating they are distinct data points despite the identical naming.
* **System Stabilization:** By iteration 400, the system appears to have reached a steady state where only "Artificial Intelligence (AI)" and "Human Well-being" retain any measurable centrality, with AI being the clear primary bridge node.
### Interpretation
This data likely represents the evolution of a co-occurrence network or a semantic map of research topics.
The "Blue" node (Closed-Loop Life Cycle Design) appears to be the initial seed or the primary focus of the system at the start. However, as the iterations progress, the network shifts its focus. The rise of the "Brown" node (Artificial Intelligence) suggests that AI became the central "bridge" or connector between disparate concepts in the network.
The rapid decay of the other nodes (Green, Red, Purple, etc.) suggests that these concepts were either transient, highly specific to the initial conditions, or were subsumed by the broader, more central concepts of AI and Human Well-being. The chart demonstrates a transition from a highly fragmented, multi-polar network to a more consolidated structure dominated by AI.
DECODING INTELLIGENCE...
EXPERT: gemini-3.1-pro-preview VERSION 1
RUNTIME: gemini/gemini-3.1-pro-preview
INTEL_VERIFIED
## Line Chart: Evolution of Top 10 Bridge Nodes Over Iterations
### Overview
This image is a line chart displaying the evolution of a network metric ("Betweenness Centrality") for ten specific nodes over a series of iterations. The chart shows high initial volatility for most nodes, followed by a general trend of decay, with one notable exception that maintains a high centrality throughout the observed period.
### Components/Axes
**Spatial Layout:**
* **Header (Top Center):** Contains the chart title.
* **Main Chart (Center/Left):** Contains the plotted data lines against a grid.
* **Legend (Right):** Positioned outside the main plotting area, listing the data series.
**Text and Labels:**
* **Title:** "Evolution of Top 10 Bridge Nodes Over Iterations"
* **Y-Axis (Left side, vertical):**
* Label: "Betweenness Centrality"
* Scale: Linear, ranging from 0.0 to 0.7.
* Markers: 0.0, 0.1, 0.2, 0.3, 0.4, 0.5, 0.6, 0.7.
* **X-Axis (Bottom, horizontal):**
* Label: "Iteration"
* Scale: Linear, ranging from 0 to slightly over 1000.
* Markers: 0, 200, 400, 600, 800, 1000.
**Legend (Top-Right to Bottom-Right):**
* Blue line with circular markers: Closed-Loop Life Cycle Design
* Orange line with circular markers: Human Well-being
* Green line with circular markers: Feedback Mechanism
* Red line with circular markers: Adaptive
* Purple line with circular markers: Adaptability and Resilience of Cities
* Brown line with circular markers: Artificial Intelligence (AI)
* Pink line with circular markers: Environmental Sustainability
* Grey line with circular markers: Outcome
* Olive/Yellow-Green line with circular markers: Closed-loop Life Cycle Design *(Note: Differs from the first entry only by a lowercase 'l' in 'loop')*
* Cyan/Light Blue line with circular markers: Bio-inspired Materials
### Detailed Analysis
The data series can be categorized by their visual trends and behaviors over the iterations.
**1. The Initial Outlier (Immediate Spike and Crash)**
* **Blue (Closed-Loop Life Cycle Design):** This line begins at the absolute highest point on the chart at Iteration 0, with a Betweenness Centrality of approximately ~0.70. It immediately plummets in a near-vertical drop, reaching ~0.0 by Iteration ~20, and remains flat at 0.0 for the remainder of the chart.
**2. The Long-Term Dominant Node**
* **Brown (Artificial Intelligence (AI)):** This line exhibits a unique trend. It starts near 0, spikes sharply upward to ~0.45 around Iteration 50. It remains highly volatile but elevated, fluctuating between ~0.30 and ~0.45 until Iteration ~400. After Iteration 400, it begins a slow, steady downward slope, ending at approximately ~0.25 at Iteration 1000. It is the highest-ranking node from Iteration ~150 onward.
**3. Mid-Term Volatile Nodes**
* **Orange (Human Well-being):** Slopes upward rapidly, spiking to ~0.55 around Iteration 10. It drops, then forms a second peak at ~0.45 near Iteration 100, and a third peak at ~0.25 near Iteration 200. Afterward, it follows a long, slow decay curve, stabilizing around ~0.05 by Iteration 1000.
* **Grey (Outcome):** Shows early volatility, peaking at ~0.40 around Iteration 100. It drops to ~0.20, holds steady briefly, then drops sharply to ~0.05 around Iteration 250. It slowly decays to approximately ~0.02 by Iteration 1000.
**4. Early Spikers with Rapid Decay**
* **Green (Feedback Mechanism):** Spikes to ~0.50 around Iteration 50, then rapidly slopes downward, falling below 0.05 by Iteration 200 and flatlining near 0.0.
* **Red (Adaptive):** Spikes to ~0.50 around Iteration 40, rapidly decays to near 0.0 by Iteration 100, and flatlines.
* **Purple (Adaptability and Resilience of Cities):** Spikes to ~0.45 very early (Iteration ~10), drops to near 0.0 by Iteration 50, and flatlines.
* **Pink (Environmental Sustainability):** Spikes to ~0.45 at Iteration ~5, plummets to near 0.0 by Iteration 20, and flatlines.
* **Olive (Closed-loop Life Cycle Design):** Spikes to ~0.35 at Iteration ~5, drops to near 0.0 by Iteration 50, and flatlines.
* **Cyan (Bio-inspired Materials):** Spikes to ~0.35 at Iteration ~20, drops, has a minor secondary bump to ~0.10 at Iteration 80, then decays to near 0.0 by Iteration 200.
### Key Observations
* **Dominance of AI:** "Artificial Intelligence (AI)" is the only node that maintains significant betweenness centrality over the long term.
* **Early Network Instability:** The period between Iteration 0 and 200 is characterized by extreme volatility, with almost all nodes experiencing massive spikes and subsequent crashes.
* **Nomenclature Anomaly:** The legend contains two nearly identical entries: "Closed-Loop Life Cycle Design" (Blue) and "Closed-loop Life Cycle Design" (Olive). Despite the similar names, their data paths are distinct, though both crash to zero very early.
* **Convergence:** By Iteration 1000, 8 out of the 10 nodes have converged to a centrality score of nearly 0.0.
### Interpretation
**Data Context:**
In network theory, "Betweenness Centrality" measures how often a node acts as a bridge along the shortest path between two other nodes. A high score indicates a node is a critical bottleneck or a vital conduit for information/relationships in the network. The "Iterations" likely represent a machine learning training process, an evolutionary algorithm, or a dynamic network simulation where connections are being rewired over time.
**Peircean Investigative Analysis (Reading Between the Lines):**
1. **Network Reorganization:** The chart visually demonstrates a network undergoing massive structural reorganization. At Iteration 0, "Closed-Loop Life Cycle Design" is the absolute center of the network (the primary bridge). However, the system immediately rejects this structure, causing that node's centrality to collapse.
2. **The Rise of AI as the Core Hub:** As the initial concepts (Sustainability, Resilience, Bio-materials) lose their bridging status, "Artificial Intelligence (AI)" emerges as the dominant structural bridge. The data suggests that as the model/network iterates and "learns" or "optimizes," AI becomes the central connecting theme that links all other disparate concepts together.
3. **Concept Marginalization:** The fact that 8 out of 10 nodes drop to near-zero centrality indicates that the network is becoming highly centralized around a few key hubs (primarily AI, and to a lesser extent, Human Well-being). The other concepts are likely being pushed to the periphery of the network; they still exist, but they no longer serve as bridges between other clusters of information.
4. **The Duplicate Entry:** The presence of "Closed-Loop" and "Closed-loop" suggests a potential data cleaning issue in the source dataset (case sensitivity creating two distinct nodes for the same concept). Interestingly, the network algorithm treats them differently initially, but ultimately marginalizes both of them equally fast.
DECODING INTELLIGENCE...
EXPERT: nemotron-free VERSION 1
RUNTIME: free/nvidia/nemotron-nano-12b-v2-vl:free
INTEL_VERIFIED
## Line Chart: Evolution of Top 10 Bridge Nodes Over Iterations
### Overview
The chart visualizes the evolution of betweenness centrality for 10 bridge nodes across 1000 iterations. Each line represents a node, with its color and label defined in the legend. The y-axis measures "Betweenness Centrality" (0–0.7), and the x-axis tracks "Iteration" (0–1000). Key trends include sharp declines in centrality for most nodes, with one node (Artificial Intelligence) maintaining relatively stable values.
### Components/Axes
- **X-axis**: "Iteration" (0–1000), with gridlines at 0, 200, 400, 600, 800, 1000.
- **Y-axis**: "Betweenness Centrality" (0–0.7), with gridlines at 0, 0.1, 0.2, 0.3, 0.4, 0.5, 0.6, 0.7.
- **Legend**: Located on the right, with 10 entries. Colors and labels:
- Blue: Closed-loop Life Cycle Design
- Orange: Human Well-being
- Green: Feedback Mechanism
- Red: Adaptive
- Purple: Adaptability and Resilience of Cities
- Brown: Artificial Intelligence (AI)
- Pink: Environmental Sustainability
- Gray: Outcome
- Yellow: Closed-loop Life Cycle Design (duplicate)
- Cyan: Bio-inspired Materials
### Detailed Analysis
1. **Blue (Closed-loop Life Cycle Design)**: Starts at ~0.7, drops sharply to ~0.05 by iteration 100.
2. **Orange (Human Well-being)**: Starts at ~0.55, declines gradually to ~0.05 by iteration 1000.
3. **Green (Feedback Mechanism)**: Starts at ~0.5, drops to ~0.02 by iteration 100.
4. **Red (Adaptive)**: Starts at ~0.48, declines to ~0.01 by iteration 100.
5. **Purple (Adaptability and Resilience of Cities)**: Starts at ~0.45, drops to ~0.01 by iteration 100.
6. **Brown (Artificial Intelligence)**: Starts at ~0.42, fluctuates but stabilizes around ~0.25 by iteration 1000.
7. **Pink (Environmental Sustainability)**: Starts at ~0.4, drops to ~0.01 by iteration 100.
8. **Gray (Outcome)**: Starts at ~0.38, declines to ~0.01 by iteration 100.
9. **Yellow (Closed-loop Life Cycle Design)**: Duplicate of blue; starts at ~0.35, drops to ~0.01 by iteration 100.
10. **Cyan (Bio-inspired Materials)**: Starts at ~0.3, drops to ~0.01 by iteration 100.
### Key Observations
- **Artificial Intelligence (Brown)** is the only node that does not drop to near-zero centrality, maintaining ~0.25 by iteration 1000.
- **Closed-loop Life Cycle Design** (blue and yellow) shows the sharpest initial decline, suggesting rapid loss of centrality.
- **Human Well-being** (orange) and **Feedback Mechanism** (green) exhibit gradual declines, indicating slower adaptation.
- **Adaptive**, **Adaptability and Resilience of Cities**, **Environmental Sustainability**, **Outcome**, and **Bio-inspired Materials** all drop to near-zero centrality by iteration 100.
- **Legend duplication**: "Closed-loop Life Cycle Design" appears twice (blue and yellow), which may indicate a labeling error.
### Interpretation
The data suggests that **Artificial Intelligence (AI)** maintains higher betweenness centrality over iterations, possibly due to its adaptability or structural resilience. Other nodes, such as **Closed-loop Life Cycle Design** and **Human Well-being**, experience significant declines, implying reduced relevance or integration over time. The duplicated label for "Closed-loop Life Cycle Design" introduces ambiguity, potentially skewing interpretation. The sharp declines in most nodes highlight the dynamic nature of bridge node centrality, with AI emerging as a stable outlier. This could reflect the prioritization of AI in network evolution or its inherent capacity to sustain connectivity.
DECODING INTELLIGENCE...