## Line Chart: Evolution of Top 10 Bridge Nodes Over Iterations
### Overview
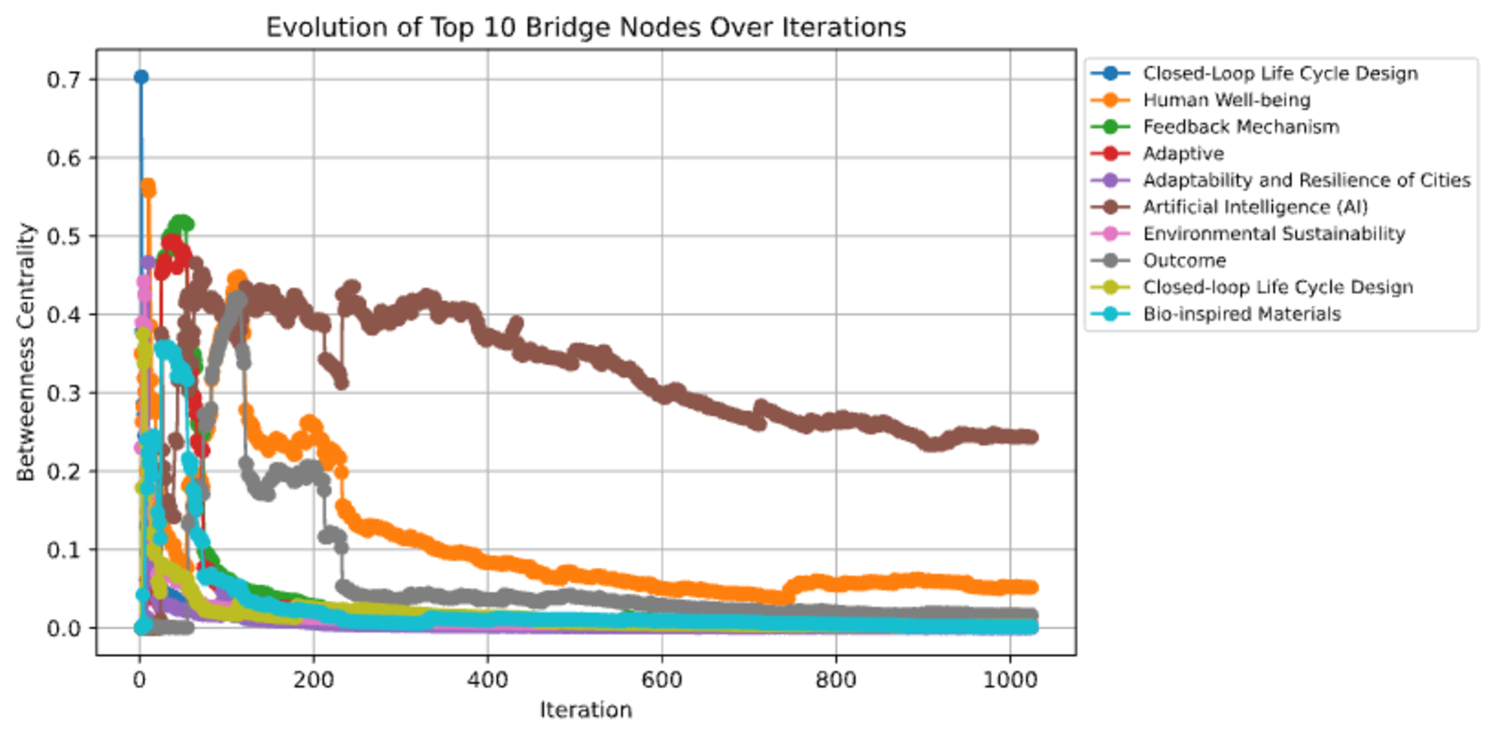
The image is a line chart that illustrates the evolution of betweenness centrality for the top 10 bridge nodes over a series of iterations. The chart displays how the importance or influence of different nodes (represented by different categories) changes as the iterations progress. The x-axis represents the iteration number, and the y-axis represents the betweenness centrality.
### Components/Axes
* **Title:** Evolution of Top 10 Bridge Nodes Over Iterations
* **X-axis:**
* Label: Iteration
* Scale: 0 to 1000, with major ticks at 0, 200, 400, 600, 800, and 1000.
* **Y-axis:**
* Label: Betweenness Centrality
* Scale: 0.0 to 0.7, with major ticks at 0.0, 0.1, 0.2, 0.3, 0.4, 0.5, 0.6, and 0.7.
* **Legend:** Located on the top-right of the chart, the legend maps the line colors to the following categories:
* Blue: Closed-Loop Life Cycle Design
* Orange: Human Well-being
* Green: Feedback Mechanism
* Red: Adaptive
* Purple: Adaptability and Resilience of Cities
* Brown: Artificial Intelligence (AI)
* Pink: Environmental Sustainability
* Gray: Outcome
* Yellow-Green: Closed-loop Life Cycle Design
* Teal: Bio-inspired Materials
### Detailed Analysis
Here's a breakdown of each data series and its trend:
1. **Closed-Loop Life Cycle Design (Blue):** Starts at approximately 0.7 at iteration 0, then rapidly decreases to near 0.0 by iteration 100, and remains relatively stable near 0.0 for the rest of the iterations.
2. **Human Well-being (Orange):** Starts at approximately 0.57 at iteration 0, decreases to approximately 0.1 at iteration 200, and then gradually decreases to approximately 0.05 by iteration 1000.
3. **Feedback Mechanism (Green):** Starts at approximately 0.52 at iteration 0, decreases rapidly to near 0.0 by iteration 100, and remains relatively stable near 0.0 for the rest of the iterations.
4. **Adaptive (Red):** Starts at approximately 0.47 at iteration 0, decreases rapidly to near 0.0 by iteration 100, and remains relatively stable near 0.0 for the rest of the iterations.
5. **Adaptability and Resilience of Cities (Purple):** Starts at approximately 0.45 at iteration 0, decreases rapidly to near 0.0 by iteration 100, and remains relatively stable near 0.0 for the rest of the iterations.
6. **Artificial Intelligence (AI) (Brown):** Starts at approximately 0.44 at iteration 0, fluctuates between 0.45 and 0.30 until iteration 800, and then stabilizes around 0.27 by iteration 1000.
7. **Environmental Sustainability (Pink):** Starts at approximately 0.42 at iteration 0, decreases rapidly to near 0.0 by iteration 100, and remains relatively stable near 0.0 for the rest of the iterations.
8. **Outcome (Gray):** Starts at approximately 0.22 at iteration 0, decreases rapidly to near 0.0 by iteration 200, and remains relatively stable near 0.0 for the rest of the iterations.
9. **Closed-loop Life Cycle Design (Yellow-Green):** Starts at approximately 0.55 at iteration 0, decreases rapidly to near 0.0 by iteration 100, and remains relatively stable near 0.0 for the rest of the iterations.
10. **Bio-inspired Materials (Teal):** Starts at approximately 0.02 at iteration 0, remains relatively stable near 0.0 for the rest of the iterations.
### Key Observations
* The "Closed-Loop Life Cycle Design" node (blue line) has the highest initial betweenness centrality, peaking at approximately 0.7, but quickly drops to near zero.
* The "Artificial Intelligence (AI)" node (brown line) maintains a relatively high betweenness centrality compared to other nodes throughout the iterations, although it decreases over time.
* Most of the nodes experience a rapid decrease in betweenness centrality within the first 200 iterations.
* The "Bio-inspired Materials" node (teal line) consistently has a very low betweenness centrality throughout the iterations.
### Interpretation
The chart suggests that the "Closed-Loop Life Cycle Design" node is initially the most influential or important bridge node, but its influence diminishes rapidly. The "Artificial Intelligence (AI)" node maintains a more sustained level of influence compared to the other nodes, indicating its continued importance as a bridge node throughout the iterations. The rapid decline in betweenness centrality for most nodes suggests that their importance as bridge nodes decreases significantly as the iterations progress. The consistently low betweenness centrality of the "Bio-inspired Materials" node indicates that it is not a significant bridge node in this context. The data demonstrates the dynamic nature of node importance in a network, where some nodes initially have high influence but lose it over time, while others maintain a more consistent level of influence.