## Line Chart: Evolution of Top 10 Bridge Nodes Over Iterations
### Overview
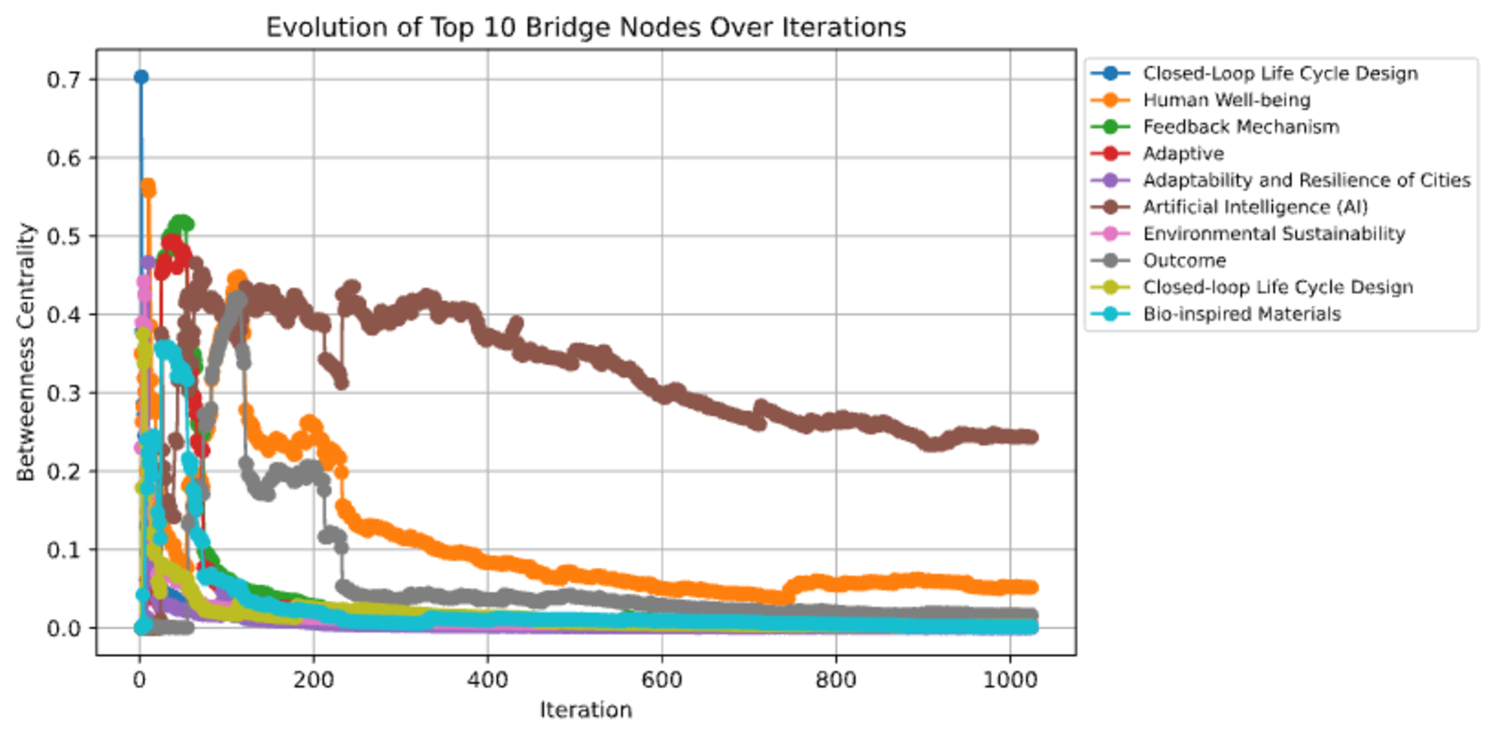
This chart illustrates the temporal evolution of "Betweenness Centrality" for ten distinct nodes within a network over approximately 1,000 iterations. The chart tracks how the relative importance (centrality) of specific concepts shifts as the system progresses. The data suggests a dynamic network where most nodes experience a brief period of high centrality early in the process, while one specific node ("Artificial Intelligence (AI)") sustains high centrality over the long term.
### Components/Axes
* **Chart Type:** Multi-series line chart.
* **X-Axis:** Labeled "Iteration," ranging from 0 to 1,000.
* **Y-Axis:** Labeled "Betweenness Centrality," ranging from 0.0 to 0.7.
* **Legend:** Positioned in the top-right quadrant. It lists 10 categories, each associated with a specific line color:
* **Blue:** Closed-Loop Life Cycle Design
* **Orange:** Human Well-being
* **Green:** Feedback Mechanism
* **Red:** Adaptive
* **Purple:** Adaptability and Resilience of Cities
* **Brown:** Artificial Intelligence (AI)
* **Pink:** Environmental Sustainability
* **Grey:** Outcome
* **Yellow/Gold:** Closed-loop Life Cycle Design (Note: This is a duplicate label of the Blue entry, but represents a distinct data series).
* **Cyan:** Bio-inspired Materials
### Detailed Analysis
The chart displays significant volatility in the first 150 iterations, followed by a stabilization phase for most variables.
* **Blue (Closed-Loop Life Cycle Design):** Starts at the maximum value of 0.7 at iteration 0. It drops precipitously, reaching near-zero values by iteration 50.
* **Brown (Artificial Intelligence (AI)):** This is the most distinct trend. It begins near 0, rises sharply to ~0.4 by iteration 100, and maintains a plateau between 0.35 and 0.45 until approximately iteration 250. Following this, it exhibits a slow, steady decay, ending at approximately 0.25 at iteration 1,000.
* **Orange (Human Well-being):** Spikes to ~0.55 at iteration 10. It undergoes a steady, multi-stage decay, dropping to ~0.2 by iteration 250, and eventually stabilizing at a low value (~0.05) from iteration 400 onwards.
* **Grey (Outcome):** Remains near 0 until iteration 100, where it spikes to ~0.4. It then drops sharply to ~0.05 by iteration 250, where it remains for the duration.
* **Other Nodes (Green, Red, Purple, Pink, Yellow, Cyan):** These nodes exhibit high volatility in the initial 0–100 iteration window. They peak at various points between 0.2 and 0.5, but all collapse to near-zero values before iteration 200 and remain negligible for the rest of the timeline.
### Key Observations
* **Dominant Node:** "Artificial Intelligence (AI)" (Brown) is the only node that maintains significant betweenness centrality throughout the entire duration of the iterations.
* **Initial Volatility:** The period between iterations 0 and 150 represents a "discovery" or "training" phase where the network structure is highly unstable, and multiple nodes compete for centrality.
* **Duplicate Labeling:** The legend contains two entries for "Closed-Loop Life Cycle Design" (Blue and Yellow). The Blue series starts at 0.7, while the Yellow series starts at ~0.35, indicating they are distinct data points despite the identical naming.
* **System Stabilization:** By iteration 400, the system appears to have reached a steady state where only "Artificial Intelligence (AI)" and "Human Well-being" retain any measurable centrality, with AI being the clear primary bridge node.
### Interpretation
This data likely represents the evolution of a co-occurrence network or a semantic map of research topics.
The "Blue" node (Closed-Loop Life Cycle Design) appears to be the initial seed or the primary focus of the system at the start. However, as the iterations progress, the network shifts its focus. The rise of the "Brown" node (Artificial Intelligence) suggests that AI became the central "bridge" or connector between disparate concepts in the network.
The rapid decay of the other nodes (Green, Red, Purple, etc.) suggests that these concepts were either transient, highly specific to the initial conditions, or were subsumed by the broader, more central concepts of AI and Human Well-being. The chart demonstrates a transition from a highly fragmented, multi-polar network to a more consolidated structure dominated by AI.