\n
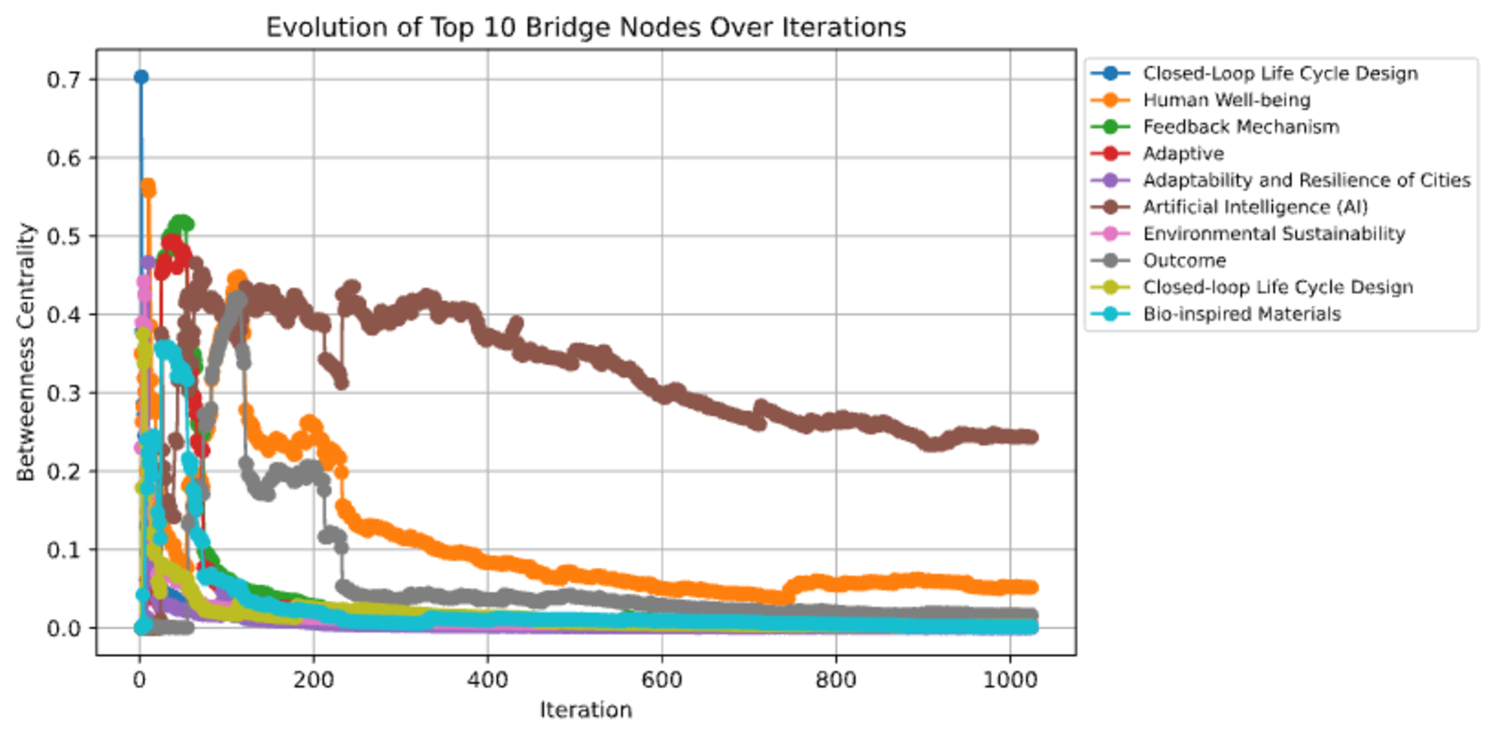
## Line Chart: Evolution of Top 10 Bridge Nodes Over Iterations
### Overview
This line chart visualizes the evolution of betweenness centrality for the top 10 bridge nodes across 1000 iterations. The y-axis represents betweenness centrality, while the x-axis represents the iteration number. Each line represents a different bridge node, and the chart illustrates how their centrality changes over time.
### Components/Axes
* **Title:** Evolution of Top 10 Bridge Nodes Over Iterations
* **X-axis Label:** Iteration (Scale: 0 to 1000, increments of 100)
* **Y-axis Label:** Betweenness Centrality (Scale: 0.0 to 0.7, increments of 0.1)
* **Legend:** Located in the top-right corner, listing the 10 bridge nodes with corresponding colors.
* Closed-Loop Life Cycle Design (Blue)
* Human Well-being (Orange)
* Feedback Mechanism (Green)
* Adaptive (Red)
* Adaptability and Resilience of Cities (Gray)
* Artificial Intelligence (AI) (Purple)
* Environmental Sustainability (Pink)
* Outcome (Brown)
* Closed-loop Life Cycle Design (Yellow)
* Bio-inspired Materials (Teal)
### Detailed Analysis
Here's a breakdown of each line's trend and approximate data points. Note that values are estimated due to the chart's resolution.
* **Closed-Loop Life Cycle Design (Blue):** Starts at approximately 0.42, rapidly decreases to around 0.05 by iteration 100, and remains relatively stable around 0.02-0.03 for the remainder of the iterations.
* **Human Well-being (Orange):** Begins at approximately 0.38, declines steadily to around 0.08 by iteration 200, then plateaus around 0.05-0.07 for the rest of the iterations.
* **Feedback Mechanism (Green):** Starts at around 0.40, decreases to approximately 0.10 by iteration 100, then gradually declines to around 0.03-0.05 by iteration 1000.
* **Adaptive (Red):** Starts at approximately 0.35, decreases to around 0.25 by iteration 100, then slowly declines to around 0.20-0.22 by iteration 1000.
* **Adaptability and Resilience of Cities (Gray):** Begins at approximately 0.41, decreases to around 0.28 by iteration 100, and then stabilizes around 0.26-0.28 for the remainder of the iterations.
* **Artificial Intelligence (AI) (Purple):** Starts at approximately 0.39, decreases to around 0.15 by iteration 100, and then gradually declines to around 0.05-0.07 by iteration 1000.
* **Environmental Sustainability (Pink):** Begins at approximately 0.37, decreases to around 0.07 by iteration 100, and then remains relatively stable around 0.03-0.05 for the rest of the iterations.
* **Outcome (Brown):** Starts at approximately 0.36, decreases to around 0.06 by iteration 100, and then remains relatively stable around 0.02-0.04 for the rest of the iterations.
* **Closed-loop Life Cycle Design (Yellow):** Begins at approximately 0.34, decreases to around 0.05 by iteration 100, and then remains relatively stable around 0.02-0.03 for the rest of the iterations.
* **Bio-inspired Materials (Teal):** Starts at approximately 0.33, decreases to around 0.04 by iteration 100, and then remains relatively stable around 0.01-0.02 for the rest of the iterations.
### Key Observations
* Most nodes exhibit a rapid decrease in betweenness centrality within the first 100 iterations.
* After the initial decline, the centrality values tend to stabilize, indicating that the nodes' influence within the network diminishes and then plateaus.
* "Adaptability and Resilience of Cities" (Gray) maintains a relatively high centrality compared to other nodes throughout the iterations.
* "Bio-inspired Materials" (Teal) consistently has the lowest centrality values.
* There is a clustering of centrality values between approximately 0.20 and 0.30 for several nodes after iteration 200.
### Interpretation
The chart suggests that the network undergoes a significant restructuring in the initial stages (first 100 iterations), leading to a reduction in the influence of most of the top 10 bridge nodes. This could indicate that the network is converging towards a more stable configuration where the initial key nodes become less central. The stabilization of centrality values after iteration 100 suggests that the network has reached a relatively steady state.
The consistently high centrality of "Adaptability and Resilience of Cities" implies that this node plays a crucial role in maintaining the network's structure and function. Conversely, the low centrality of "Bio-inspired Materials" suggests that this node has limited influence within the network.
The overall trend indicates a shift in network dynamics, where the initial bridge nodes lose prominence, and the network potentially reorganizes around other nodes or connections. This could be due to the iterative process itself, where the network adapts and evolves over time. The chart provides valuable insights into the evolving relationships between different nodes and their impact on the overall network structure.