TECHNICAL ASSET FINGERPRINT
751ddbe81ce1bba1885ed774
Click to view fullscreen
Press ESC or click to close
FOUND IN PAPERS
EXPERT: healer-alpha-free VERSION 1
RUNTIME: free/openrouter/healer-alpha
INTEL_VERIFIED
\n
## Line Chart: Evolution of Top 10 Bridge Nodes Over Iterations
### Overview
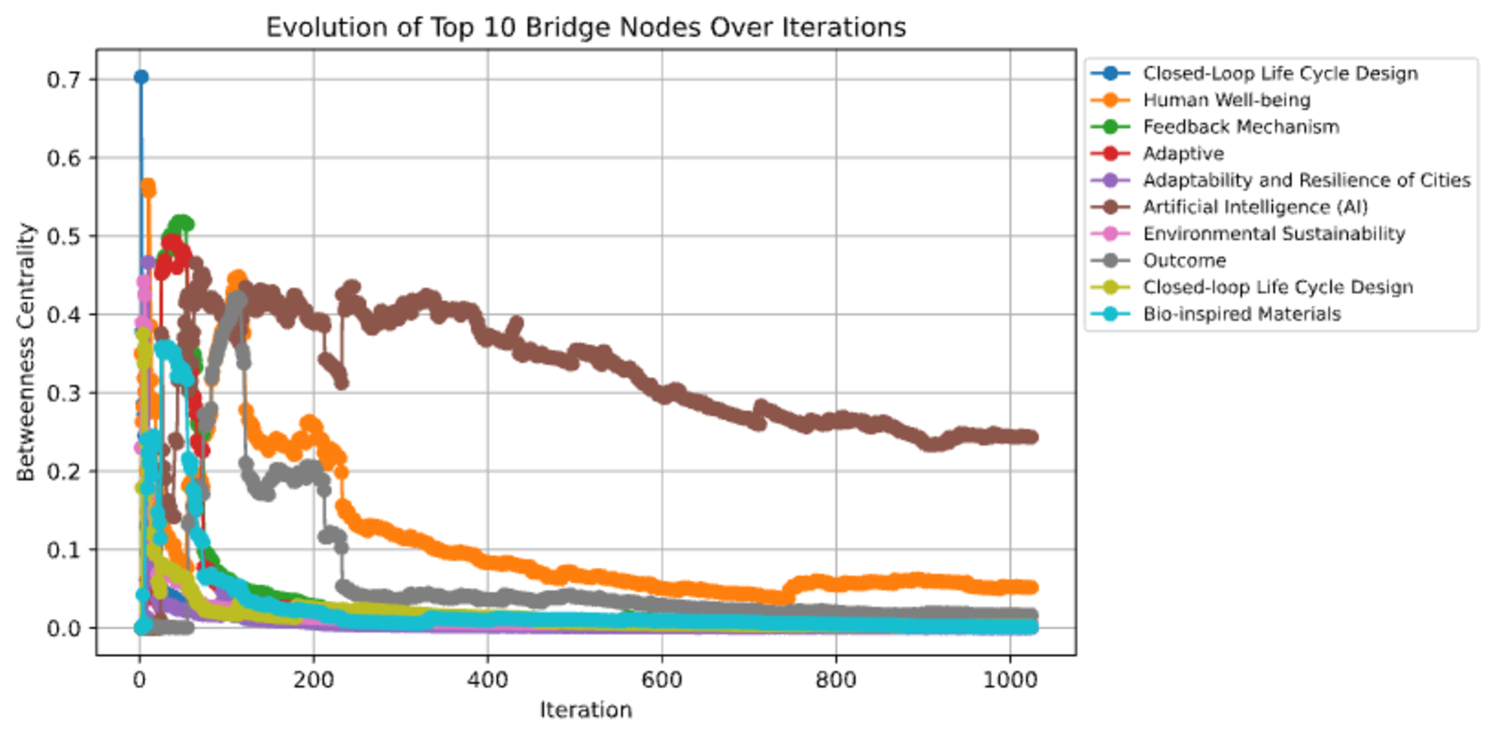
The image is a line chart titled "Evolution of Top 10 Bridge Nodes Over Iterations." It plots the "Betweenness Centrality" of ten distinct conceptual nodes against the number of "Iterations," showing how their relative importance within a network changes over time. The chart displays significant initial volatility, with most nodes experiencing a rapid decline in centrality, followed by a long tail where values stabilize at lower levels.
### Components/Axes
* **Chart Title:** "Evolution of Top 10 Bridge Nodes Over Iterations" (centered at the top).
* **Y-Axis:** Labeled "Betweenness Centrality." The scale runs from 0.0 to 0.7, with major gridlines at intervals of 0.1.
* **X-Axis:** Labeled "Iteration." The scale runs from 0 to 1000, with major gridlines and labels at intervals of 200 (0, 200, 400, 600, 800, 1000).
* **Legend:** Positioned in the top-right corner, outside the main plot area. It lists 10 data series with corresponding colored markers and lines:
1. **Closed-Loop Life Cycle Design** (Blue line, circle marker)
2. **Human Well-being** (Orange line, circle marker)
3. **Feedback Mechanism** (Green line, circle marker)
4. **Adaptive** (Red line, circle marker)
5. **Adaptability and Resilience of Cities** (Purple line, circle marker)
6. **Artificial Intelligence (AI)** (Brown line, circle marker)
7. **Environmental Sustainability** (Pink line, circle marker)
8. **Outcome** (Gray line, circle marker)
9. **Closed-loop Life Cycle Design** (Yellow-green line, circle marker) *[Note: This appears to be a duplicate or variant of item 1, with slightly different capitalization]*
10. **Bio-inspired Materials** (Cyan line, circle marker)
### Detailed Analysis
**Trend Verification & Data Points (Approximate Values):**
* **Closed-Loop Life Cycle Design (Blue):** Starts at the highest point on the chart (~0.70 at Iteration 0). Experiences an extremely sharp, near-vertical drop within the first ~50 iterations, falling below 0.1. Continues a gradual decline, converging with the cluster of low-centrality lines near 0.0 by iteration 200 and remaining there.
* **Human Well-being (Orange):** Starts very high (~0.56 at Iteration 0). Drops sharply but less vertically than the blue line, showing some volatility between iterations 0-100. It has a secondary peak around iteration 150 (~0.45) before entering a steady, gradual decline. It remains the second-highest line for most of the chart after iteration 200, ending at approximately 0.05 at iteration 1000.
* **Feedback Mechanism (Green):** Starts moderately high (~0.45 at Iteration 0). Peaks early at approximately iteration 50 (~0.52). Then declines sharply, joining the low-centrality cluster below 0.1 by iteration 200.
* **Adaptive (Red):** Starts high (~0.49 at Iteration 0). Shows a volatile decline in the first 100 iterations, with a notable dip and recovery. It falls below 0.1 by iteration 200 and remains near zero.
* **Adaptability and Resilience of Cities (Purple):** Starts at a moderate level (~0.38 at Iteration 0). Declines rapidly and smoothly, reaching near-zero values by iteration 100 and staying there.
* **Artificial Intelligence (AI) (Brown):** Exhibits a unique trend. Starts moderately (~0.35 at Iteration 0). Instead of an immediate drop, it rises to become the dominant line, peaking broadly between iterations 150-300 at approximately 0.43. After iteration 300, it begins a long, steady, and relatively smooth decline, but maintains a significantly higher centrality than all other nodes except "Human Well-being" for the entire duration. It ends at approximately 0.24 at iteration 1000.
* **Environmental Sustainability (Pink):** Starts moderately (~0.44 at Iteration 0). Declines very rapidly, reaching near-zero by iteration 100 and remaining flat.
* **Outcome (Gray):** Starts moderately (~0.39 at Iteration 0). Shows a volatile decline similar to "Adaptive," with a distinct dip around iteration 200 (~0.18). It stabilizes at a low level (~0.02-0.03) after iteration 300.
* **Closed-loop Life Cycle Design (Yellow-green):** Starts moderately (~0.36 at Iteration 0). Declines rapidly, joining the near-zero cluster by iteration 200.
* **Bio-inspired Materials (Cyan):** Starts moderately (~0.37 at Iteration 0). Declines rapidly, joining the near-zero cluster by iteration 200.
**Spatial Grounding & Component Isolation:**
* **Header Region (Title):** Clear and descriptive.
* **Main Chart Region:** The plot area is dominated by two distinct visual groups after iteration 200:
1. **High-Centrality Group:** The brown line ("AI") and, to a lesser extent, the orange line ("Human Well-being") occupy the upper portion of the chart (centrality > 0.05).
2. **Low-Centrality Cluster:** The remaining eight lines converge into a dense, overlapping band very close to the x-axis (centrality ≈ 0.0 to 0.05). Individual lines in this cluster are difficult to distinguish after iteration 400.
* **Footer Region (Axes):** Labels are clear. The x-axis extends slightly beyond the last data point at iteration 1000.
### Key Observations
1. **Initial Dominance and Collapse:** Several nodes ("Closed-Loop Life Cycle Design," "Human Well-being," "Feedback Mechanism") start with very high betweenness centrality (>0.5) but collapse within the first 10-20% of the iterations.
2. **The Anomaly of AI:** "Artificial Intelligence (AI)" is the clear outlier. It not only avoids the immediate collapse but gains centrality early on, sustaining a position of high importance throughout the entire process. Its decline is much more gradual.
3. **Convergence to Low Importance:** By iteration 400, 8 out of the 10 tracked nodes have betweenness centrality values at or very near zero, indicating they have ceased to act as significant bridges in the network.
4. **Two-Tiered Outcome:** The final state (iteration 1000) shows a clear hierarchy: "AI" is the most central bridge node (~0.24), "Human Well-being" is a distant second (~0.05), and all others are negligible.
### Interpretation
This chart likely visualizes the results of a network analysis simulation, possibly in the context of systems design, innovation research, or conceptual modeling. "Betweenness Centrality" measures how often a node lies on the shortest path between other nodes, making it a key indicator of a node's role as a connector or broker of information/flow.
The data suggests a dynamic process where the network structure rapidly reorganizes. Initially, many concepts act as critical bridges, but this structure is unstable. The network quickly evolves to rely on a much smaller set of concepts for connectivity.
The sustained high centrality of **"Artificial Intelligence (AI)"** implies that, within the modeled system, AI consistently serves as a fundamental connector between other ideas or components throughout its evolution. Its role is not only persistent but becomes increasingly dominant as other potential bridges fade.
The early collapse of nodes like **"Closed-Loop Life Cycle Design"** and **"Feedback Mechanism"** suggests these concepts, while initially important for connecting parts of the system, become either integrated into other processes (losing their distinct bridging role) or marginalized as the network optimizes.
The **"Human Well-being"** node's trajectory is notable—it remains relevant as a secondary bridge, indicating it retains a consistent, though not primary, connecting function in the mature system.
**Overall, the chart tells a story of network simplification and the emergence of a dominant, resilient connector (AI) from an initially complex and distributed bridging structure.** This could reflect a design process converging on a core technology, a knowledge network solidifying around a key paradigm, or a system finding its most efficient architecture.
DECODING INTELLIGENCE...