## Line Chart: Evolution of Top 10 Bridge Nodes Over Iterations
### Overview
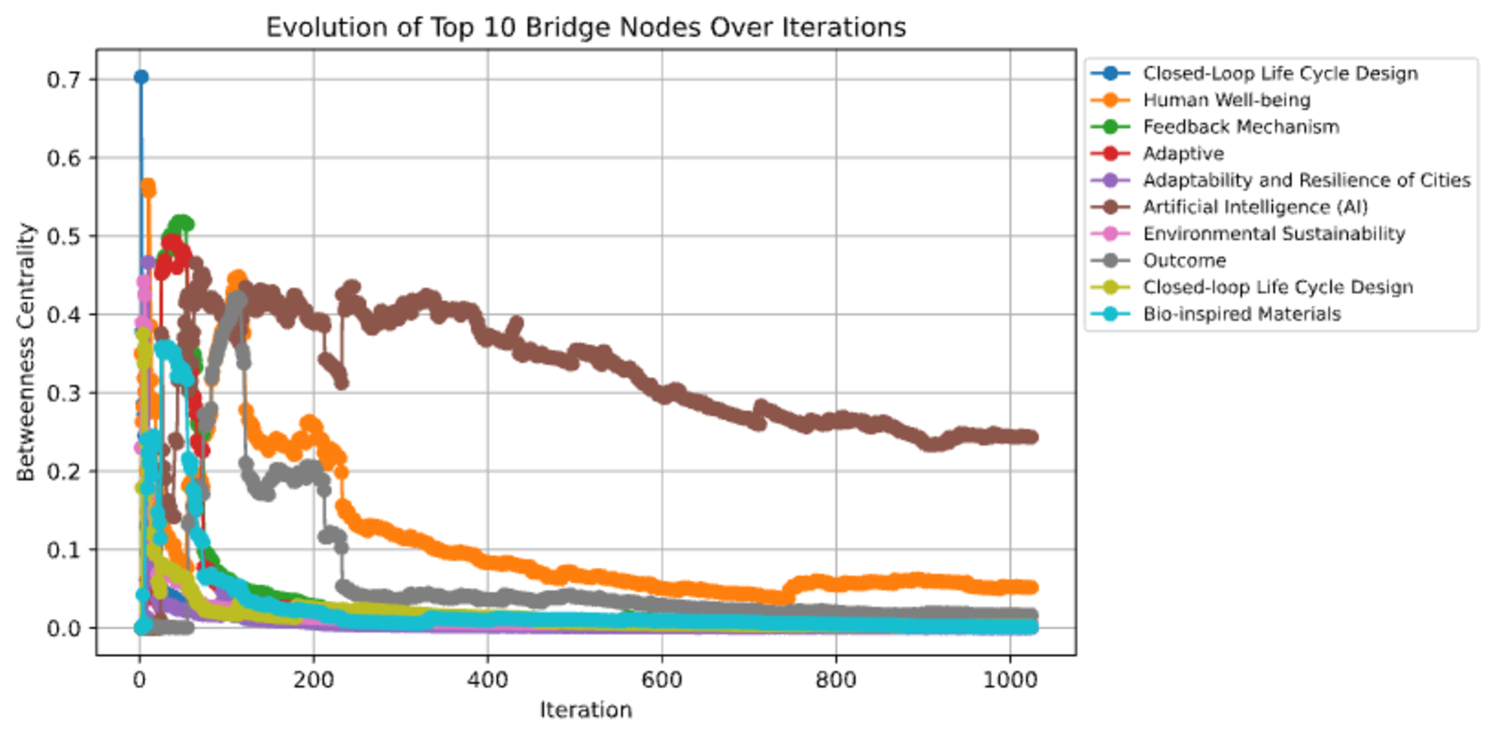
The chart visualizes the evolution of betweenness centrality for 10 bridge nodes across 1000 iterations. Each line represents a node, with its color and label defined in the legend. The y-axis measures "Betweenness Centrality" (0–0.7), and the x-axis tracks "Iteration" (0–1000). Key trends include sharp declines in centrality for most nodes, with one node (Artificial Intelligence) maintaining relatively stable values.
### Components/Axes
- **X-axis**: "Iteration" (0–1000), with gridlines at 0, 200, 400, 600, 800, 1000.
- **Y-axis**: "Betweenness Centrality" (0–0.7), with gridlines at 0, 0.1, 0.2, 0.3, 0.4, 0.5, 0.6, 0.7.
- **Legend**: Located on the right, with 10 entries. Colors and labels:
- Blue: Closed-loop Life Cycle Design
- Orange: Human Well-being
- Green: Feedback Mechanism
- Red: Adaptive
- Purple: Adaptability and Resilience of Cities
- Brown: Artificial Intelligence (AI)
- Pink: Environmental Sustainability
- Gray: Outcome
- Yellow: Closed-loop Life Cycle Design (duplicate)
- Cyan: Bio-inspired Materials
### Detailed Analysis
1. **Blue (Closed-loop Life Cycle Design)**: Starts at ~0.7, drops sharply to ~0.05 by iteration 100.
2. **Orange (Human Well-being)**: Starts at ~0.55, declines gradually to ~0.05 by iteration 1000.
3. **Green (Feedback Mechanism)**: Starts at ~0.5, drops to ~0.02 by iteration 100.
4. **Red (Adaptive)**: Starts at ~0.48, declines to ~0.01 by iteration 100.
5. **Purple (Adaptability and Resilience of Cities)**: Starts at ~0.45, drops to ~0.01 by iteration 100.
6. **Brown (Artificial Intelligence)**: Starts at ~0.42, fluctuates but stabilizes around ~0.25 by iteration 1000.
7. **Pink (Environmental Sustainability)**: Starts at ~0.4, drops to ~0.01 by iteration 100.
8. **Gray (Outcome)**: Starts at ~0.38, declines to ~0.01 by iteration 100.
9. **Yellow (Closed-loop Life Cycle Design)**: Duplicate of blue; starts at ~0.35, drops to ~0.01 by iteration 100.
10. **Cyan (Bio-inspired Materials)**: Starts at ~0.3, drops to ~0.01 by iteration 100.
### Key Observations
- **Artificial Intelligence (Brown)** is the only node that does not drop to near-zero centrality, maintaining ~0.25 by iteration 1000.
- **Closed-loop Life Cycle Design** (blue and yellow) shows the sharpest initial decline, suggesting rapid loss of centrality.
- **Human Well-being** (orange) and **Feedback Mechanism** (green) exhibit gradual declines, indicating slower adaptation.
- **Adaptive**, **Adaptability and Resilience of Cities**, **Environmental Sustainability**, **Outcome**, and **Bio-inspired Materials** all drop to near-zero centrality by iteration 100.
- **Legend duplication**: "Closed-loop Life Cycle Design" appears twice (blue and yellow), which may indicate a labeling error.
### Interpretation
The data suggests that **Artificial Intelligence (AI)** maintains higher betweenness centrality over iterations, possibly due to its adaptability or structural resilience. Other nodes, such as **Closed-loop Life Cycle Design** and **Human Well-being**, experience significant declines, implying reduced relevance or integration over time. The duplicated label for "Closed-loop Life Cycle Design" introduces ambiguity, potentially skewing interpretation. The sharp declines in most nodes highlight the dynamic nature of bridge node centrality, with AI emerging as a stable outlier. This could reflect the prioritization of AI in network evolution or its inherent capacity to sustain connectivity.