\n
## Line Chart: Accuracy vs. Training Data
### Overview
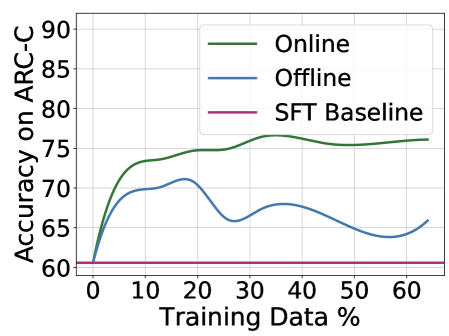
The image presents a line chart comparing the accuracy on the ARC-C dataset for three different training methods – Online, Offline, and SFT Baseline – as a function of the percentage of training data used. The chart visually demonstrates how accuracy changes as more training data is incorporated for each method.
### Components/Axes
* **X-axis:** "Training Data %", ranging from 0 to 60, with markers at 0, 10, 20, 30, 40, 50, and 60.
* **Y-axis:** "Accuracy on ARC-C", ranging from 60 to 90, with markers at 60, 65, 70, 75, 80, 85, and 90.
* **Legend:** Located in the top-right corner, identifying the three data series:
* "Online" – represented by a green line.
* "Offline" – represented by a blue line.
* "SFT Baseline" – represented by a magenta line.
* **Gridlines:** A light gray grid is present to aid in reading values.
### Detailed Analysis
* **SFT Baseline:** The magenta line representing the SFT Baseline remains relatively flat across all training data percentages, hovering around an accuracy of approximately 61-62%.
* **Offline:** The blue line representing the Offline method starts at approximately 62% accuracy at 0% training data. It increases to a peak of around 72% at approximately 15% training data, then declines to around 68% at 60% training data. The trend is initially upward, then downward, exhibiting a peak and subsequent decay.
* **Online:** The green line representing the Online method starts at approximately 62% accuracy at 0% training data. It steadily increases to approximately 76% accuracy at 60% training data. The trend is consistently upward, indicating a positive correlation between training data percentage and accuracy.
Here's a breakdown of approximate data points:
| Training Data (%) | Online Accuracy | Offline Accuracy | SFT Baseline Accuracy |
|---|---|---|---|
| 0 | 62 | 62 | 61 |
| 10 | 70 | 70 | 61 |
| 20 | 73 | 71 | 61 |
| 30 | 75 | 69 | 61 |
| 40 | 76 | 67 | 61 |
| 50 | 76 | 66 | 61 |
| 60 | 76 | 68 | 61 |
### Key Observations
* The Online method consistently outperforms both the Offline and SFT Baseline methods across all training data percentages.
* The Offline method shows an initial improvement with increasing training data, but its accuracy plateaus and then declines.
* The SFT Baseline method exhibits minimal improvement with increasing training data, remaining relatively constant.
* The Offline method's peak accuracy is significantly lower than the Online method's final accuracy.
### Interpretation
The data suggests that the Online training method is the most effective for improving accuracy on the ARC-C dataset, as its performance consistently increases with more training data. The Offline method demonstrates diminishing returns, with accuracy peaking and then decreasing, potentially indicating overfitting or the limitations of the offline training approach. The SFT Baseline method's consistent low accuracy suggests it is not sensitive to the amount of training data and may represent a lower bound on achievable performance.
The contrast between the Online and Offline methods could be due to the benefits of continuous learning and adaptation inherent in the Online approach, allowing it to better generalize to the data. The SFT Baseline's lack of improvement suggests that the initial supervised fine-tuning is insufficient for achieving high accuracy on this dataset, and further training is required. The peak and decline of the Offline method could indicate that the model begins to memorize the training data rather than learning generalizable patterns, leading to reduced performance on unseen data.