# Technical Document Analysis: Line Graph of "Attention over Values, a=16"
## **1. Image Description**
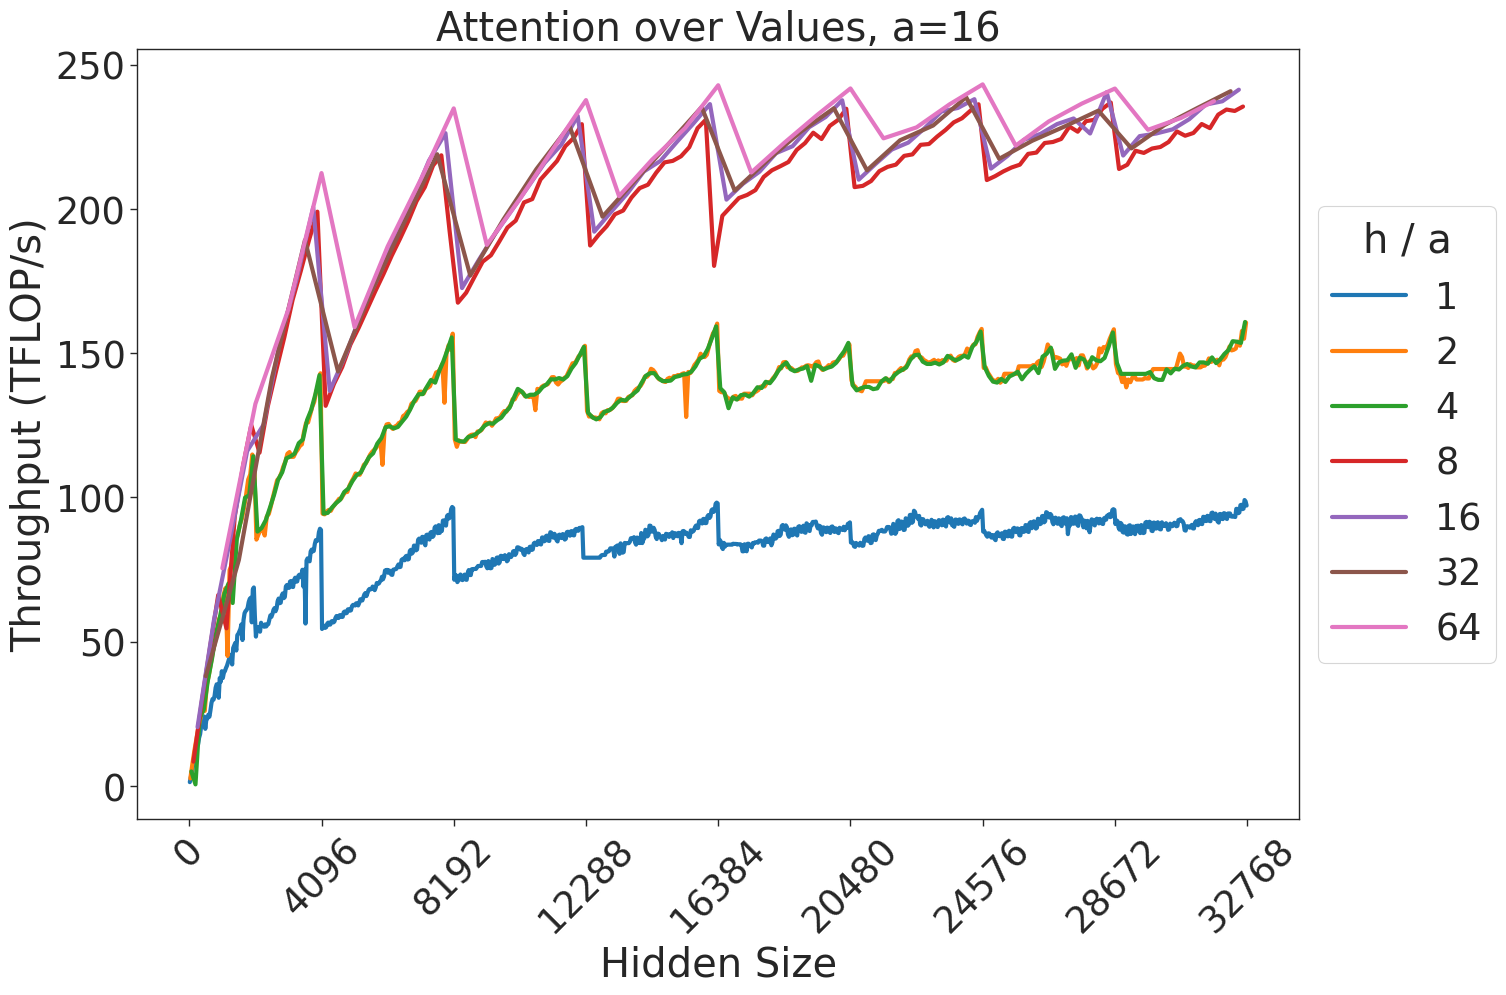
The image is a **line graph** titled **"Attention over Values, a=16"**. It visualizes the relationship between **Hidden Size** (x-axis) and **Throughput (TFLOPs/s)** (y-axis). The graph includes **seven distinct data series**, each represented by a colored line corresponding to different **h/a ratios** (1, 2, 4, 8, 16, 32, 64). The legend is positioned on the **right side** of the plot area.
---
## **2. Axis Labels and Markers**
- **X-axis (Hidden Size)**:
- Range: **0 to 32768**
- Tick marks at: **0, 4096, 8192, 12288, 16384, 20480, 24576, 28672, 32768**
- Labels: Numerical values (e.g., "0", "4096", etc.).
- **Y-axis (Throughput (TFLOPs/s))**:
- Range: **0 to 250**
- Tick marks at: **0, 50, 100, 150, 200, 250**
- Labels: Numerical values (e.g., "0", "50", etc.).
---
## **3. Legend and Data Series**
The legend maps **h/a ratios** to **line colors** as follows:
| **h/a Ratio** | **Color** | **Line Description** |
|---------------|-----------|----------------------|
| 1 | Blue | Lowest throughput, gradual increase. |
| 2 | Orange | Moderate throughput, moderate fluctuations. |
| 4 | Green | Higher throughput, moderate fluctuations. |
| 8 | Red | High throughput, sharp peaks and troughs. |
| 16 | Purple | Very high throughput, consistent peaks. |
| 32 | Brown | High throughput, smooth curve. |
| 64 | Pink | Highest throughput, jagged peaks. |
**Spatial Grounding**:
- The legend is located **outside the plot area** on the **right side**.
- Each line’s color **matches the legend entries exactly** (e.g., blue for h/a=1, pink for h/a=64).
---
## **4. Key Trends and Data Points**
### **Line 1 (h/a=1, Blue)**
- **Trend**: Starts at **0 TFLOPs/s**, gradually increases to a **peak of ~100 TFLOPs/s** around **Hidden Size = 8192**, then plateaus.
- **Data Points**:
- At **Hidden Size = 0**: 0 TFLOPs/s.
- At **Hidden Size = 4096**: ~60 TFLOPs/s.
- At **Hidden Size = 8192**: ~100 TFLOPs/s.
- At **Hidden Size = 32768**: ~100 TFLOPs/s.
### **Line 2 (h/a=2, Orange)**
- **Trend**: Starts at **0 TFLOPs/s**, rises to a **peak of ~150 TFLOPs/s** around **Hidden Size = 8192**, then fluctuates.
- **Data Points**:
- At **Hidden Size = 0**: 0 TFLOPs/s.
- At **Hidden Size = 4096**: ~100 TFLOPs/s.
- At **Hidden Size = 8192**: ~150 TFLOPs/s.
- At **Hidden Size = 32768**: ~150 TFLOPs/s.
### **Line 3 (h/a=4, Green)**
- **Trend**: Starts at **0 TFLOPs/s**, rises to a **peak of ~150 TFLOPs/s** around **Hidden Size = 8192**, then fluctuates.
- **Data Points**:
- At **Hidden Size = 0**: 0 TFLOPs/s.
- At **Hidden Size = 4096**: ~120 TFLOPs/s.
- At **Hidden Size = 8192**: ~150 TFLOPs/s.
- At **Hidden Size = 32768**: ~150 TFLOPs/s.
### **Line 4 (h/a=8, Red)**
- **Trend**: Starts at **0 TFLOPs/s**, rises to a **peak of ~200 TFLOPs/s** around **Hidden Size = 8192**, then fluctuates.
- **Data Points**:
- At **Hidden Size = 0**: 0 TFLOPs/s.
- At **Hidden Size = 4096**: ~140 TFLOPs/s.
- At **Hidden Size = 8192**: ~200 TFLOPs/s.
- At **Hidden Size = 32768**: ~200 TFLOPs/s.
### **Line 5 (h/a=16, Purple)**
- **Trend**: Starts at **0 TFLOPs/s**, rises to a **peak of ~230 TFLOPs/s** around **Hidden Size = 8192**, then fluctuates.
- **Data Points**:
- At **Hidden Size = 0**: 0 TFLOPs/s.
- At **Hidden Size = 4096**: ~160 TFLOPs/s.
- At **Hidden Size = 8192**: ~230 TFLOPs/s.
- At **Hidden Size = 32768**: ~230 TFLOPs/s.
### **Line 6 (h/a=32, Brown)**
- **Trend**: Starts at **0 TFLOPs/s**, rises to a **peak of ~230 TFLOPs/s** around **Hidden Size = 8192**, then fluctuates.
- **Data Points**:
- At **Hidden Size = 0**: 0 TFLOPs/s.
- At **Hidden Size = 4096**: ~180 TFLOPs/s.
- At **Hidden Size = 8192**: ~230 TFLOPs/s.
- At **Hidden Size = 32768**: ~230 TFLOPs/s.
### **Line 7 (h/a=64, Pink)**
- **Trend**: Starts at **0 TFLOPs/s**, rises to a **peak of ~240 TFLOPs/s** around **Hidden Size = 8192**, then fluctuates.
- **Data Points**:
- At **Hidden Size = 0**: 0 TFLOPs/s.
- At **Hidden Size = 4096**: ~200 TFLOPs/s.
- At **Hidden Size = 8192**: ~240 TFLOPs/s.
- At **Hidden Size = 32768**: ~240 TFLOPs/s.
---
## **5. Observations**
- **Higher h/a ratios** (e.g., 16, 32, 64) exhibit **higher throughput** and **more consistent performance** compared to lower ratios.
- **Lower h/a ratios** (e.g., 1, 2, 4) show **lower throughput** and **greater variability** in performance.
- The **peak throughput** for all lines occurs near **Hidden Size = 8192**, after which performance stabilizes or declines slightly.
---
## **6. Additional Notes**
- The graph does not include a **data table** or **embedded text** beyond the axis labels and legend.
- The **x-axis** and **y-axis** are clearly labeled, and all numerical values are explicitly marked.
- The **legend** is fully legible and spatially consistent with the data series.
---
## **7. Conclusion**
The graph demonstrates a **positive correlation** between **h/a ratio** and **throughput**, with higher ratios achieving greater computational efficiency. The **Hidden Size** parameter influences performance, with optimal results observed at **Hidden Size = 8192** for most h/a ratios.