\n
## Line Chart: Surprise vs. Training Steps
### Overview
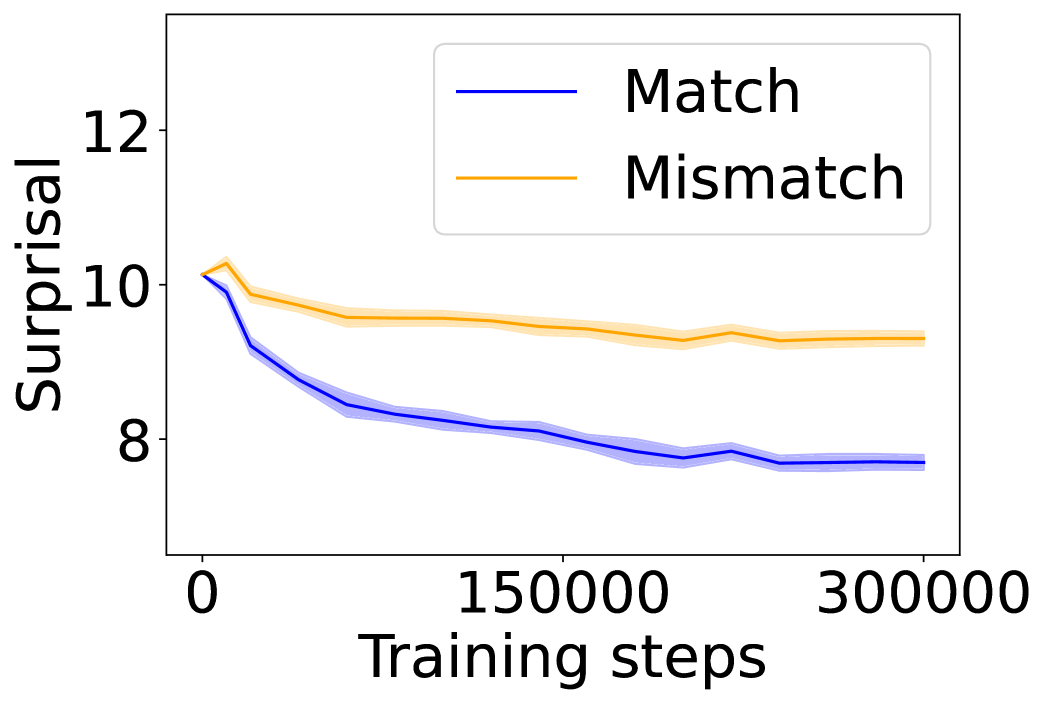
The image presents a line chart illustrating the relationship between "Surprisal" and "Training steps" for two conditions: "Match" and "Mismatch". The chart shows how surprisal changes as the model undergoes training.
### Components/Axes
* **X-axis:** "Training steps", ranging from approximately 0 to 300,000.
* **Y-axis:** "Surprisal", ranging from approximately 7 to 12.
* **Data Series 1:** "Match" - represented by a blue line.
* **Data Series 2:** "Mismatch" - represented by an orange line.
* **Legend:** Located in the top-right corner, labeling the two data series with their corresponding colors.
### Detailed Analysis
The chart displays two downward-trending lines.
**Match (Blue Line):**
The blue line, representing "Match", starts at approximately 9.4 at 0 training steps. It consistently decreases, exhibiting a relatively smooth downward slope. At approximately 150,000 training steps, the value is around 8.2. By 300,000 training steps, the value stabilizes around 7.6.
**Mismatch (Orange Line):**
The orange line, representing "Mismatch", begins at approximately 10.2 at 0 training steps. It initially decreases more rapidly than the blue line, but the rate of decrease slows down. At approximately 150,000 training steps, the value is around 9.3. By 300,000 training steps, the value is approximately 9.6. The orange line exhibits more fluctuation than the blue line.
### Key Observations
* Both "Match" and "Mismatch" show a decreasing trend in surprisal as training steps increase, indicating that the model is learning and becoming more confident in its predictions.
* The "Match" condition consistently exhibits lower surprisal values than the "Mismatch" condition throughout the training process.
* The "Mismatch" line shows more variability than the "Match" line, suggesting greater uncertainty or instability in the mismatch condition.
* The rate of decrease in surprisal slows down for both conditions as training progresses, indicating diminishing returns from further training.
### Interpretation
The chart suggests that the model learns to better predict or represent data when there is a "Match" (presumably between input and expected output). The decreasing surprisal indicates that the model is becoming more confident in its predictions for matched data. The higher surprisal values for "Mismatch" data suggest that the model finds it more difficult to predict or represent mismatched data. The fluctuations in the "Mismatch" line could indicate that the model is struggling to generalize from mismatched examples, or that the mismatched data is inherently more noisy or complex. The convergence of the lines at higher training steps suggests that the model is approaching a point of diminishing returns, where further training yields only marginal improvements in surprisal reduction. This data could be used to evaluate the effectiveness of a training regime, or to identify areas where the model could benefit from further refinement.